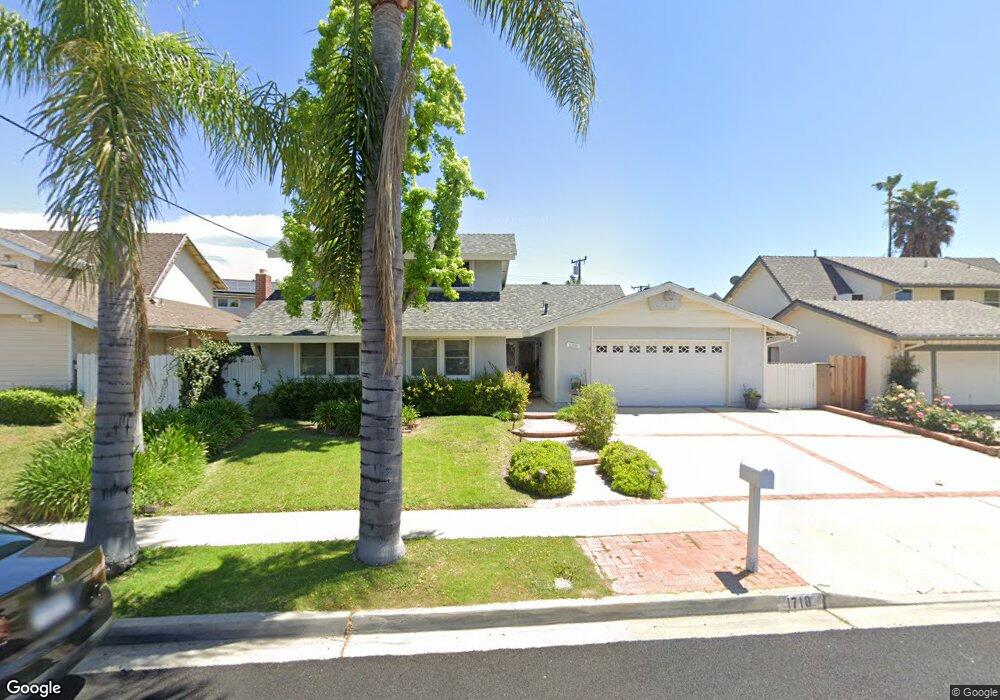
1718 Hanley Ave Simi Valley, CA 93065
Central Simi Valley NeighborhoodEstimated Value: $911,708 - $995,000
4
Beds
2
Baths
1,465
Sq Ft
$643/Sq Ft
Est. Value
About This Home
This home is located at 1718 Hanley Ave, Simi Valley, CA 93065 and is currently estimated at $941,927, approximately $642 per square foot. 1718 Hanley Ave is a home located in Ventura County with nearby schools including Berylwood Elementary School, Hillside Middle School, and Royal High School.
Ownership History
Date
Name
Owned For
Owner Type
Purchase Details
Closed on
May 4, 2016
Sold by
Brown Teri Lee
Bought by
Brown Teri Lee
Current Estimated Value
Purchase Details
Closed on
Sep 14, 1993
Sold by
Oneil J Michael and Oneil Eve
Bought by
Brown Christopher Denning and Brown Teri Lee
Home Financials for this Owner
Home Financials are based on the most recent Mortgage that was taken out on this home.
Original Mortgage
$180,000
Interest Rate
6.81%
Create a Home Valuation Report for This Property
The Home Valuation Report is an in-depth analysis detailing your home's value as well as a comparison with similar homes in the area
Home Values in the Area
Average Home Value in this Area
Purchase History
| Date | Buyer | Sale Price | Title Company |
|---|---|---|---|
| Brown Teri Lee | -- | None Available | |
| Brown Christopher Denning | $205,000 | United Title Company |
Source: Public Records
Mortgage History
| Date | Status | Borrower | Loan Amount |
|---|---|---|---|
| Closed | Brown Christopher Denning | $180,000 |
Source: Public Records
Tax History Compared to Growth
Tax History
| Year | Tax Paid | Tax Assessment Tax Assessment Total Assessment is a certain percentage of the fair market value that is determined by local assessors to be the total taxable value of land and additions on the property. | Land | Improvement |
|---|---|---|---|---|
| 2025 | $4,375 | $339,839 | $135,934 | $203,905 |
| 2024 | $4,375 | $333,176 | $133,269 | $199,907 |
| 2023 | $4,112 | $326,644 | $130,656 | $195,988 |
| 2022 | $4,080 | $320,240 | $128,094 | $192,146 |
| 2021 | $4,036 | $313,961 | $125,582 | $188,379 |
| 2020 | $3,943 | $310,745 | $124,296 | $186,449 |
| 2019 | $3,761 | $304,653 | $121,859 | $182,794 |
| 2018 | $3,720 | $298,680 | $119,470 | $179,210 |
| 2017 | $3,630 | $292,825 | $117,128 | $175,697 |
| 2016 | $3,464 | $287,084 | $114,832 | $172,252 |
| 2015 | $3,384 | $282,773 | $113,108 | $169,665 |
| 2014 | $3,342 | $277,237 | $110,894 | $166,343 |
Source: Public Records
Map
Nearby Homes
- 2368 Heywood St
- 2783 Fallon Cir
- 2750 Hollister St
- 2149 Madrone St
- 2349 Knollhaven St
- 2149 Clover St
- 2730 Niles St
- 2886 Galena Ave
- 2266 Lansdale Ct
- 2320 Lupin St
- 2095 Morley St
- 2466 Royal Ave
- 2146 N Brower St
- 2346 Royal Ave Unit 9
- 3045 Galena Ave
- 2391 Heather St
- 2559 Cochran St
- 2332 N Justin Ave
- 2357 Lawnview Ct
- 3082 Galena Ave
- 1704 Hanley Ave
- 1730 Hanley Ave
- 2561 Heywood St
- 1747 Fred Ave
- 1735 Fred Ave
- 1742 Hanley Ave
- 1759 Fred Ave
- 2525 Heywood St
- 2573 Heywood St
- 1729 Fred Ave
- 1723 Hanley Ave
- 1754 Hanley Ave
- 2548 Heywood St
- 1737 Hanley Ave
- 2562 Heywood St
- 2534 Heywood St
- 1717 Fred Ave
- 2585 Heywood St
- 1766 Hanley Ave
- 1751 Hanley Ave