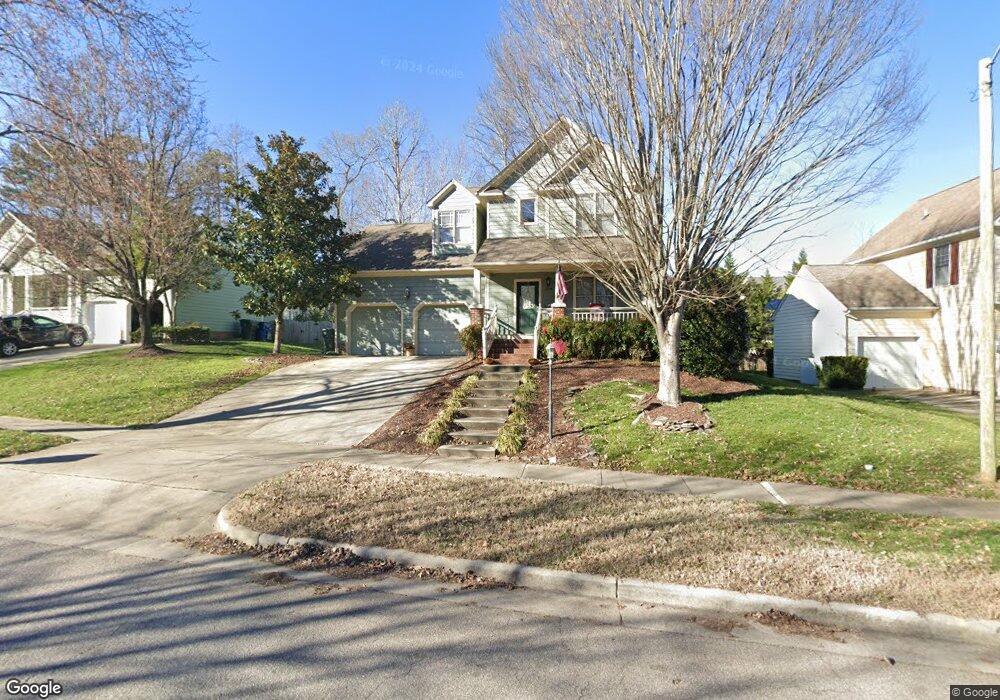
1719 Farmington Grove Dr Raleigh, NC 27614
Falls River NeighborhoodEstimated Value: $516,170 - $548,000
4
Beds
3
Baths
2,038
Sq Ft
$264/Sq Ft
Est. Value
About This Home
This home is located at 1719 Farmington Grove Dr, Raleigh, NC 27614 and is currently estimated at $537,043, approximately $263 per square foot. 1719 Farmington Grove Dr is a home located in Wake County with nearby schools including Abbotts Creek Elementary School, East Millbrook Middle, and Millbrook High School.
Ownership History
Date
Name
Owned For
Owner Type
Purchase Details
Closed on
Feb 27, 2015
Sold by
Graham Shannon Joy and Graham Kenneth
Bought by
Hardee Tanner and Hardee Ashley
Current Estimated Value
Home Financials for this Owner
Home Financials are based on the most recent Mortgage that was taken out on this home.
Original Mortgage
$278,825
Outstanding Balance
$214,102
Interest Rate
3.75%
Mortgage Type
New Conventional
Estimated Equity
$322,941
Purchase Details
Closed on
Jun 1, 2006
Sold by
Fortner Robert S and Fortner Diana H
Bought by
Mendez Shannon Joy
Home Financials for this Owner
Home Financials are based on the most recent Mortgage that was taken out on this home.
Original Mortgage
$49,900
Interest Rate
6.44%
Mortgage Type
Credit Line Revolving
Create a Home Valuation Report for This Property
The Home Valuation Report is an in-depth analysis detailing your home's value as well as a comparison with similar homes in the area
Home Values in the Area
Average Home Value in this Area
Purchase History
| Date | Buyer | Sale Price | Title Company |
|---|---|---|---|
| Hardee Tanner | $293,000 | None Available | |
| Mendez Shannon Joy | $250,000 | None Available |
Source: Public Records
Mortgage History
| Date | Status | Borrower | Loan Amount |
|---|---|---|---|
| Open | Hardee Tanner | $278,825 | |
| Previous Owner | Mendez Shannon Joy | $49,900 | |
| Previous Owner | Mendez Shannon Joy | $199,600 |
Source: Public Records
Tax History Compared to Growth
Tax History
| Year | Tax Paid | Tax Assessment Tax Assessment Total Assessment is a certain percentage of the fair market value that is determined by local assessors to be the total taxable value of land and additions on the property. | Land | Improvement |
|---|---|---|---|---|
| 2025 | $4,093 | $466,986 | $125,000 | $341,986 |
| 2024 | $4,076 | $466,986 | $125,000 | $341,986 |
| 2023 | $3,788 | $345,655 | $86,000 | $259,655 |
| 2022 | $3,520 | $345,655 | $86,000 | $259,655 |
| 2021 | $3,383 | $345,655 | $86,000 | $259,655 |
| 2020 | $3,322 | $345,655 | $86,000 | $259,655 |
| 2019 | $3,364 | $288,546 | $86,000 | $202,546 |
| 2018 | $3,173 | $288,546 | $86,000 | $202,546 |
| 2017 | $3,022 | $288,546 | $86,000 | $202,546 |
| 2016 | $2,960 | $288,546 | $86,000 | $202,546 |
| 2015 | $2,786 | $267,081 | $76,000 | $191,081 |
| 2014 | -- | $267,081 | $76,000 | $191,081 |
Source: Public Records
Map
Nearby Homes
- 1741 Farmington Grove Dr
- 10205 Sorrills Creek Ln
- 10415 Ashmead Ln
- 1310 Durlain Dr Unit 103
- 1700 Southwell Ct
- 1301 Durlain Dr Unit 103
- 10209 River Bank Dr
- 11001 Louson Place
- 11020 Southwalk Ln
- 10204 River Bank Dr
- 4615 All Points View Way
- 10904 Fitzwilliam St
- 10907 Flower Bed Ct
- 1404 Mitford Woods Ct
- 2313 Filigree Ct
- 10621 Catara Dr
- 10506 Pleasant Branch Dr Unit Lot 38
- 10520 Pleasant Branch Dr Unit Lot 32
- 9013 Tenderfoot Trail
- 1505 October Rd
- 1723 Farmington Grove Dr
- 1715 Farmington Grove Dr
- 1712 Falls River Ave
- 1708 Falls River Ave
- 1731 Farmington Grove Dr
- 1709 Farmington Grove Dr
- 1716 Falls River Ave
- 1720 Farmington Grove Dr
- 1724 Farmington Grove Dr
- 1716 Farmington Grove Dr
- 1704 Falls River Ave
- 1728 Farmington Grove Dr
- 1735 Farmington Grove Dr
- 1705 Farmington Grove Dr
- 1712 Farmington Grove Dr
- 1732 Farmington Grove Dr
- 1720 Falls River Ave
- 1708 Farmington Grove Dr
- 1736 Farmington Grove Dr
- 10104 Sorrills Creek Ln