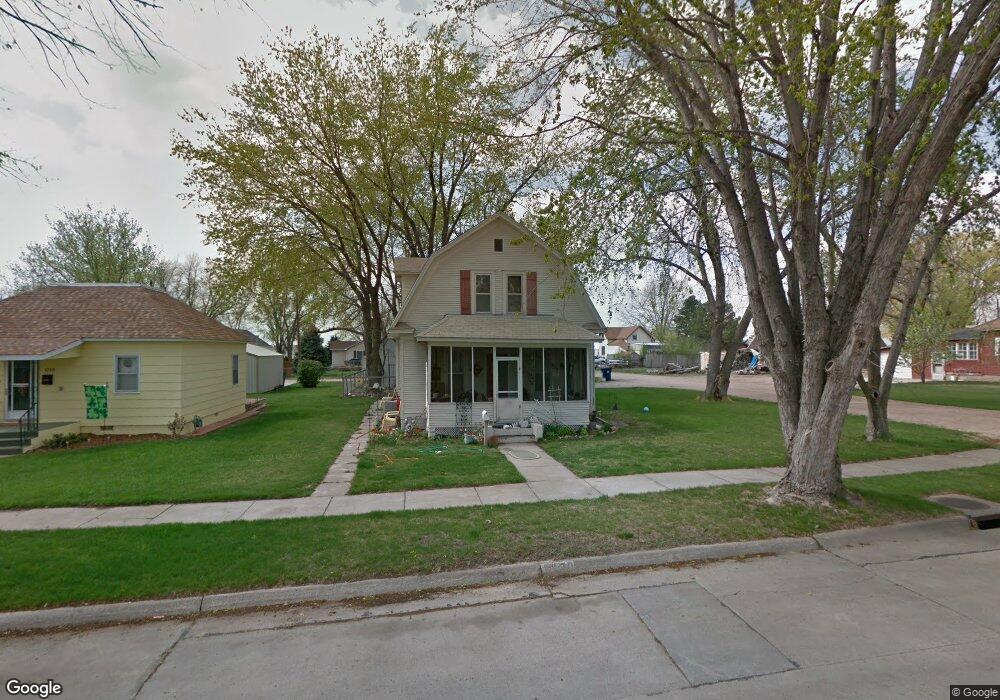
1720 Avenue B Gothenburg, NE 69138
Estimated Value: $159,000 - $173,000
4
Beds
2
Baths
1,264
Sq Ft
$132/Sq Ft
Est. Value
About This Home
This home is located at 1720 Avenue B, Gothenburg, NE 69138 and is currently estimated at $166,807, approximately $131 per square foot. 1720 Avenue B is a home located in Dawson County with nearby schools including Dudley Elementary School, Gothenburg Secondary School, and Liberty Heights Christian School.
Ownership History
Date
Name
Owned For
Owner Type
Purchase Details
Closed on
Mar 21, 2024
Sold by
Paula Anne Crowley Revocable Trust and Crowley Paula Anne
Bought by
Schafer Dalton Richard and Schafer Shae Rosalee
Current Estimated Value
Home Financials for this Owner
Home Financials are based on the most recent Mortgage that was taken out on this home.
Original Mortgage
$5,775
Outstanding Balance
$5,133
Interest Rate
6.64%
Mortgage Type
New Conventional
Estimated Equity
$161,674
Purchase Details
Closed on
Jan 28, 2022
Sold by
Earll and Connie
Bought by
Paula Anne Crowley Revocable Trust
Purchase Details
Closed on
Oct 13, 2021
Sold by
Myers James and Myers Buddi
Bought by
Earll Clayton and Earll Connie
Home Financials for this Owner
Home Financials are based on the most recent Mortgage that was taken out on this home.
Original Mortgage
$70,000
Interest Rate
2.8%
Mortgage Type
Future Advance Clause Open End Mortgage
Create a Home Valuation Report for This Property
The Home Valuation Report is an in-depth analysis detailing your home's value as well as a comparison with similar homes in the area
Home Values in the Area
Average Home Value in this Area
Purchase History
| Date | Buyer | Sale Price | Title Company |
|---|---|---|---|
| Schafer Dalton Richard | $165,000 | None Listed On Document | |
| Paula Anne Crowley Revocable Trust | $125,000 | Bacon Vinton & Venteicher Llc | |
| Earll Clayton | $70,000 | None Available |
Source: Public Records
Mortgage History
| Date | Status | Borrower | Loan Amount |
|---|---|---|---|
| Open | Schafer Dalton Richard | $5,775 | |
| Previous Owner | Earll Clayton | $70,000 |
Source: Public Records
Tax History Compared to Growth
Tax History
| Year | Tax Paid | Tax Assessment Tax Assessment Total Assessment is a certain percentage of the fair market value that is determined by local assessors to be the total taxable value of land and additions on the property. | Land | Improvement |
|---|---|---|---|---|
| 2024 | $937 | $68,766 | $5,201 | $63,565 |
| 2023 | $1,136 | $62,441 | $5,201 | $57,240 |
| 2022 | $1,056 | $54,583 | $5,201 | $49,382 |
| 2021 | $946 | $52,233 | $5,201 | $47,032 |
| 2020 | $962 | $52,233 | $5,201 | $47,032 |
| 2019 | $925 | $52,233 | $5,201 | $47,032 |
| 2018 | $1,059 | $58,075 | $4,875 | $53,200 |
| 2017 | $1,003 | $55,616 | $4,875 | $50,741 |
| 2016 | $1,010 | $56,680 | $4,875 | $51,805 |
| 2015 | $1,069 | $55,616 | $4,875 | $50,741 |
| 2014 | $107 | $53,485 | $4,875 | $48,610 |
| 2013 | $107 | $53,485 | $4,875 | $48,610 |
Source: Public Records
Map
Nearby Homes