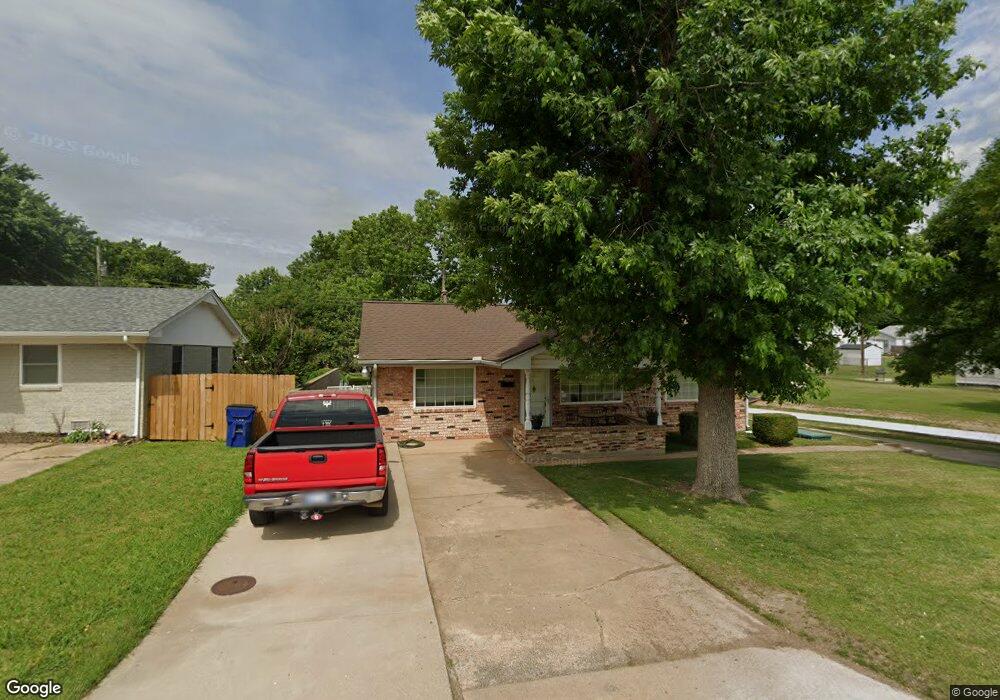
1722 S Jensen Ave El Reno, OK 73036
Estimated Value: $160,000 - $190,000
2
Beds
2
Baths
1,586
Sq Ft
$111/Sq Ft
Est. Value
About This Home
This home is located at 1722 S Jensen Ave, El Reno, OK 73036 and is currently estimated at $176,826, approximately $111 per square foot. 1722 S Jensen Ave is a home located in Canadian County with nearby schools including Hillcrest Elementary School, Rose Witcher Elementary School, and Lincoln Learning Center.
Ownership History
Date
Name
Owned For
Owner Type
Purchase Details
Closed on
Apr 20, 2007
Sold by
Earley Michael A and Earley Georgia
Bought by
Ward John B and Ward Becky R
Current Estimated Value
Home Financials for this Owner
Home Financials are based on the most recent Mortgage that was taken out on this home.
Original Mortgage
$95,203
Outstanding Balance
$57,562
Interest Rate
6.15%
Mortgage Type
VA
Estimated Equity
$119,264
Purchase Details
Closed on
Jun 17, 2005
Sold by
Martell Marian Louise and Martell William Edward
Bought by
Earley Michael A and Earley Georgia
Home Financials for this Owner
Home Financials are based on the most recent Mortgage that was taken out on this home.
Original Mortgage
$67,920
Interest Rate
5.76%
Mortgage Type
New Conventional
Purchase Details
Closed on
Feb 4, 2003
Sold by
Martell Marian Louise
Create a Home Valuation Report for This Property
The Home Valuation Report is an in-depth analysis detailing your home's value as well as a comparison with similar homes in the area
Home Values in the Area
Average Home Value in this Area
Purchase History
| Date | Buyer | Sale Price | Title Company |
|---|---|---|---|
| Ward John B | $70,125 | None Available | |
| Earley Michael A | $63,750 | None Available | |
| -- | -- | -- |
Source: Public Records
Mortgage History
| Date | Status | Borrower | Loan Amount |
|---|---|---|---|
| Open | Ward John B | $95,203 | |
| Previous Owner | Earley Michael A | $67,920 |
Source: Public Records
Tax History Compared to Growth
Tax History
| Year | Tax Paid | Tax Assessment Tax Assessment Total Assessment is a certain percentage of the fair market value that is determined by local assessors to be the total taxable value of land and additions on the property. | Land | Improvement |
|---|---|---|---|---|
| 2024 | $1,448 | $14,953 | $2,880 | $12,073 |
| 2023 | $1,448 | $14,518 | $2,880 | $11,638 |
| 2022 | $1,409 | $14,095 | $2,880 | $11,215 |
| 2021 | $1,397 | $13,684 | $2,880 | $10,804 |
| 2020 | $1,337 | $13,286 | $2,880 | $10,406 |
| 2019 | $1,352 | $12,899 | $2,880 | $10,019 |
| 2018 | $1,296 | $12,523 | $2,880 | $9,643 |
| 2017 | $1,280 | $12,159 | $2,880 | $9,279 |
| 2016 | $1,249 | $12,159 | $2,880 | $9,279 |
| 2015 | $1,141 | $11,368 | $2,880 | $8,488 |
| 2014 | $1,141 | $11,037 | $2,880 | $8,157 |
Source: Public Records
Map
Nearby Homes
- 1705 S Dille Ave
- 601 Thompson Dr
- 605 Thompson Dr
- 300 Cherokee Ln
- 1127 S Reno Ave
- 602 W Elm St
- 1012 S Ellison Ave
- 1309 Fairfax Ln
- 1646 U S Route 66
- 1502 S Reno Ave
- 420 SW 24th St
- 508 SW 24th St
- 800 Fairfax Ln
- 503 W Owens St
- 1118 S Barker Ave
- 717 S Miles Ave
- 912 S Rock Island Ave
- 821 S Bickford Ave
- 1220 Strawberry Fields
- 1515 Strawberry Fields
- 1724 S Jensen Ave
- 1726 S Jensen Ave
- 1705 S Jensen Ave
- 1728 S Jensen Ave
- 1716 S Jensen Ave
- 1725 S Dille Ave
- 1711 S Dille Ave
- 1727 S Dille Ave
- 1712 S Jensen Ave
- 1729 S Jensen Ave
- 1709 S Dille Ave
- 1708 S Jensen Ave
- 1724 S Dille Ave
- 1707 S Dille Ave
- 214 W Underwood St
- 1801 S Dille Ave
- 1802 S Jensen Ave
- 1726 S Dille Ave
- 1722 S Dille Ave
- 212 W Underwood St