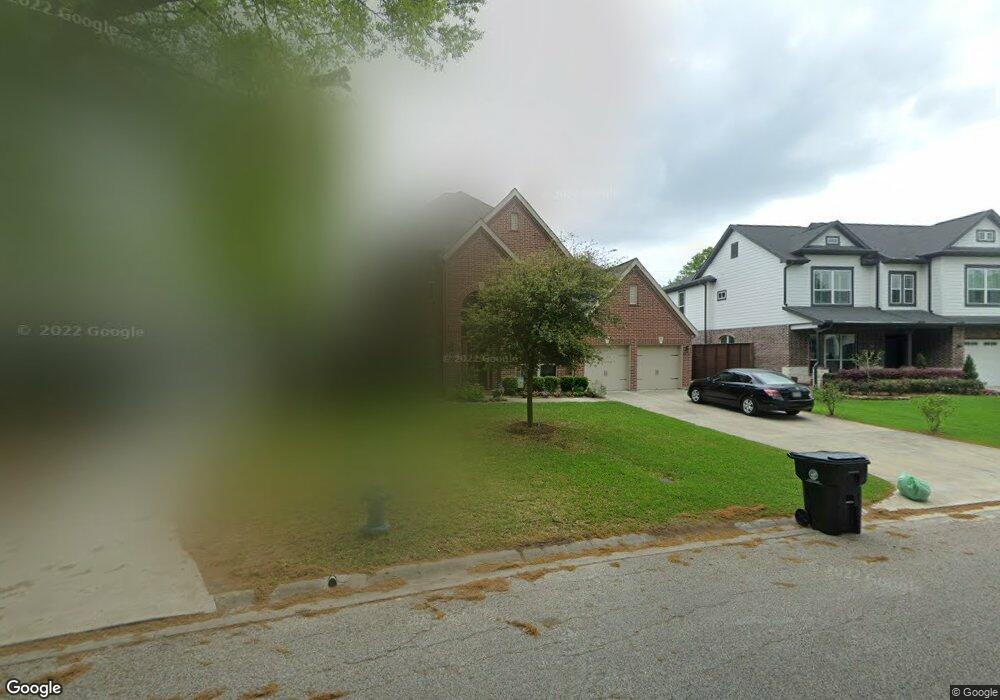
1723 Nina Lee Ln Houston, TX 77018
Oak Forest-Garden Oaks NeighborhoodEstimated Value: $567,000 - $1,198,000
2
Beds
1
Bath
1,136
Sq Ft
$889/Sq Ft
Est. Value
About This Home
This home is located at 1723 Nina Lee Ln, Houston, TX 77018 and is currently estimated at $1,009,362, approximately $888 per square foot. 1723 Nina Lee Ln is a home located in Harris County with nearby schools including Stevens Elementary School, Frank Black Middle School, and Waltrip High School.
Ownership History
Date
Name
Owned For
Owner Type
Purchase Details
Closed on
Oct 31, 2016
Sold by
Perry Homes Llc
Bought by
Warnke Oliver and Calzado Maria Inmaculada
Current Estimated Value
Home Financials for this Owner
Home Financials are based on the most recent Mortgage that was taken out on this home.
Original Mortgage
$416,546
Outstanding Balance
$335,046
Interest Rate
3.48%
Mortgage Type
New Conventional
Estimated Equity
$674,316
Purchase Details
Closed on
Nov 12, 2013
Sold by
Symmank Charles
Bought by
Perry Homes Llc
Purchase Details
Closed on
Sep 24, 2010
Sold by
Symmank Susan Renee
Bought by
Symmank Charles
Purchase Details
Closed on
Apr 22, 2002
Sold by
Symmank Eddie and Symmank Carolyn
Bought by
Symmank Charles and Symmank Susan
Home Financials for this Owner
Home Financials are based on the most recent Mortgage that was taken out on this home.
Original Mortgage
$60,000
Interest Rate
6.25%
Mortgage Type
Seller Take Back
Create a Home Valuation Report for This Property
The Home Valuation Report is an in-depth analysis detailing your home's value as well as a comparison with similar homes in the area
Home Values in the Area
Average Home Value in this Area
Purchase History
| Date | Buyer | Sale Price | Title Company |
|---|---|---|---|
| Warnke Oliver | $416,546 | Chicago Title | |
| Perry Homes Llc | -- | Chicago Title | |
| Symmank Charles | -- | None Available | |
| Symmank Charles | -- | -- | |
| Symmank Eddie | -- | -- |
Source: Public Records
Mortgage History
| Date | Status | Borrower | Loan Amount |
|---|---|---|---|
| Open | Warnke Oliver | $416,546 | |
| Previous Owner | Symmank Charles | $60,000 | |
| Closed | Symmank Charles | $0 |
Source: Public Records
Tax History Compared to Growth
Tax History
| Year | Tax Paid | Tax Assessment Tax Assessment Total Assessment is a certain percentage of the fair market value that is determined by local assessors to be the total taxable value of land and additions on the property. | Land | Improvement |
|---|---|---|---|---|
| 2025 | $17,342 | $1,095,423 | $405,600 | $689,823 |
| 2024 | $17,342 | $1,086,054 | $382,200 | $703,854 |
| 2023 | $17,342 | $1,001,531 | $382,200 | $619,331 |
| 2022 | $20,817 | $945,430 | $335,400 | $610,030 |
| 2021 | $21,209 | $910,000 | $312,000 | $598,000 |
| 2020 | $20,353 | $840,480 | $312,000 | $528,480 |
| 2019 | $20,339 | $803,771 | $312,000 | $491,771 |
| 2018 | $14,956 | $750,000 | $312,000 | $438,000 |
| 2017 | $18,964 | $750,000 | $312,000 | $438,000 |
| 2016 | $7,889 | $312,000 | $312,000 | $0 |
| 2015 | $6,812 | $312,000 | $312,000 | $0 |
| 2014 | $6,812 | $265,000 | $249,600 | $15,400 |
Source: Public Records
Map
Nearby Homes
- 1720 Libbey Dr
- 1706 Hewitt Dr
- 1570 Cheshire Ln
- 1818 Nina Lee Ln
- 1522 Hewitt Dr
- 1623 Latexo Dr
- 1634 Latexo Dr
- 1611 Richelieu Ln
- 1730 Chantilly Ln
- 1514 Chantilly Ln
- 1850 Viking Dr
- 1835 Cheshire Ln
- 1506 W 43rd St
- 1527 Thornton Rd
- 1839 Bethlehem St
- 1721 Saxon Dr
- 1622 Candlelight Ln
- 1515 Thornton Rd
- 1519 Candlelight Ln
- 2007 Hewitt Dr
- 1727 Nina Lee Ln
- 1719 Nina Lee Ln
- 1706 Libbey Dr
- 1710 Libbey Dr
- 1715 Nina Lee Ln
- 1702 Libbey Dr
- 1714 Libbey Dr
- 1626 Libbey Dr
- 1724 Nina Lee Ln
- 1718 Nina Lee Ln
- 1735 Nina Lee Ln
- 1711 Nina Lee Ln
- 1728 Nina Lee Ln
- 1622 Libbey Dr
- 1712 Nina Lee Ln
- 1724 Libbey Dr
- 1732 Nina Lee Ln
- 1618 Libbey Dr
- 1739 Nina Lee Ln
- 1728 Libbey Dr