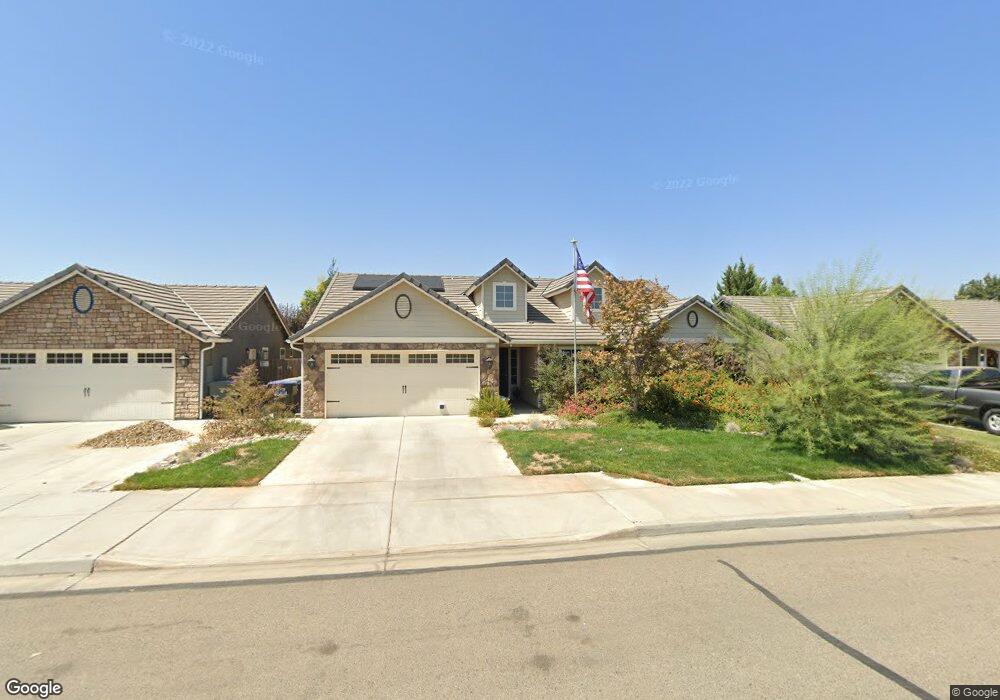
1723 S Arroyo St Visalia, CA 93292
Southeast Visalia NeighborhoodEstimated Value: $430,260 - $482,000
4
Beds
2
Baths
2,009
Sq Ft
$229/Sq Ft
Est. Value
About This Home
This home is located at 1723 S Arroyo St, Visalia, CA 93292 and is currently estimated at $459,315, approximately $228 per square foot. 1723 S Arroyo St is a home located in Tulare County with nearby schools including Mineral King Elementary School, Valley Oak Middle School, and Golden West High School.
Ownership History
Date
Name
Owned For
Owner Type
Purchase Details
Closed on
Jun 28, 2013
Sold by
Salter Jessica Lea
Bought by
Bacci Robert Michael
Current Estimated Value
Home Financials for this Owner
Home Financials are based on the most recent Mortgage that was taken out on this home.
Original Mortgage
$213,300
Outstanding Balance
$152,176
Interest Rate
3.48%
Mortgage Type
New Conventional
Estimated Equity
$307,139
Purchase Details
Closed on
Jun 19, 2013
Sold by
Lennar Fresno Inc
Bought by
Bacci Robert Michael
Home Financials for this Owner
Home Financials are based on the most recent Mortgage that was taken out on this home.
Original Mortgage
$213,300
Outstanding Balance
$152,176
Interest Rate
3.48%
Mortgage Type
New Conventional
Estimated Equity
$307,139
Purchase Details
Closed on
Jan 25, 2011
Sold by
Ennis Homes Inc
Bought by
Lennar Fresno Inc
Create a Home Valuation Report for This Property
The Home Valuation Report is an in-depth analysis detailing your home's value as well as a comparison with similar homes in the area
Home Values in the Area
Average Home Value in this Area
Purchase History
| Date | Buyer | Sale Price | Title Company |
|---|---|---|---|
| Bacci Robert Michael | -- | None Available | |
| Bacci Robert Michael | $237,000 | None Available | |
| Lennar Fresno Inc | -- | North American Title Co Inc |
Source: Public Records
Mortgage History
| Date | Status | Borrower | Loan Amount |
|---|---|---|---|
| Open | Bacci Robert Michael | $213,300 |
Source: Public Records
Tax History Compared to Growth
Tax History
| Year | Tax Paid | Tax Assessment Tax Assessment Total Assessment is a certain percentage of the fair market value that is determined by local assessors to be the total taxable value of land and additions on the property. | Land | Improvement |
|---|---|---|---|---|
| 2025 | $3,299 | $291,844 | $72,652 | $219,192 |
| 2024 | $3,299 | $286,123 | $71,228 | $214,895 |
| 2023 | $3,201 | $280,514 | $69,832 | $210,682 |
| 2022 | $3,056 | $275,014 | $68,463 | $206,551 |
| 2021 | $3,045 | $269,622 | $67,121 | $202,501 |
| 2020 | $3,013 | $266,858 | $66,433 | $200,425 |
| 2019 | $2,913 | $261,625 | $65,130 | $196,495 |
| 2018 | $2,827 | $256,495 | $63,853 | $192,642 |
| 2017 | $2,775 | $251,466 | $62,601 | $188,865 |
| 2016 | $2,786 | $246,536 | $61,374 | $185,162 |
| 2015 | $2,682 | $242,833 | $60,452 | $182,381 |
| 2014 | $2,682 | $238,076 | $59,268 | $178,808 |
Source: Public Records
Map
Nearby Homes
- 1708 S Arroyo St
- 3931 E Hillcrest Ave
- 3735 E Cambridge Ct
- 424 S McAuliff St
- 3541 E Laura Ct
- 2242 S Manzanita Ct
- 15061 Avenue 288
- 1701 S Crumal St
- 3320 E Laura Ave
- 3235 E Howard Ave
- 2207 S Crumal St
- 3926 E Myrtle Ave
- 2227 S Crumal St
- 3136 E Harter Ave
- 4122 E Kaweah Ave
- 4132 E Kaweah Ave
- 804 S Simon St
- 2017 S Velie St
- 1310 S Palm St
- 1217 S Manzanita St
- 1723 S Arroyo St Unit 198
- 1737 S Arroyo St Unit 199
- 1737 S Arroyo St
- 1707 S Arroyo St
- 1745 S Arroyo St Unit 200
- 1745 S Arroyo St
- 1726 S Casablanca St
- 1712 S Casablanca St
- 1712 S Casablanca St Unit 206
- 1734 S Casablanca St
- 1746 S Casablanca St
- 1724 S Arroyo St
- 1736 S Arroyo St
- 1753 S Arroyo St Unit 201
- 1753 S Arroyo St
- 1744 S Arroyo St
- 1750 S Casablanca St
- 4224 E Harvard Ave Unit 181
- 4224 E Harvard Ave
- 4216 E Harvard Ave