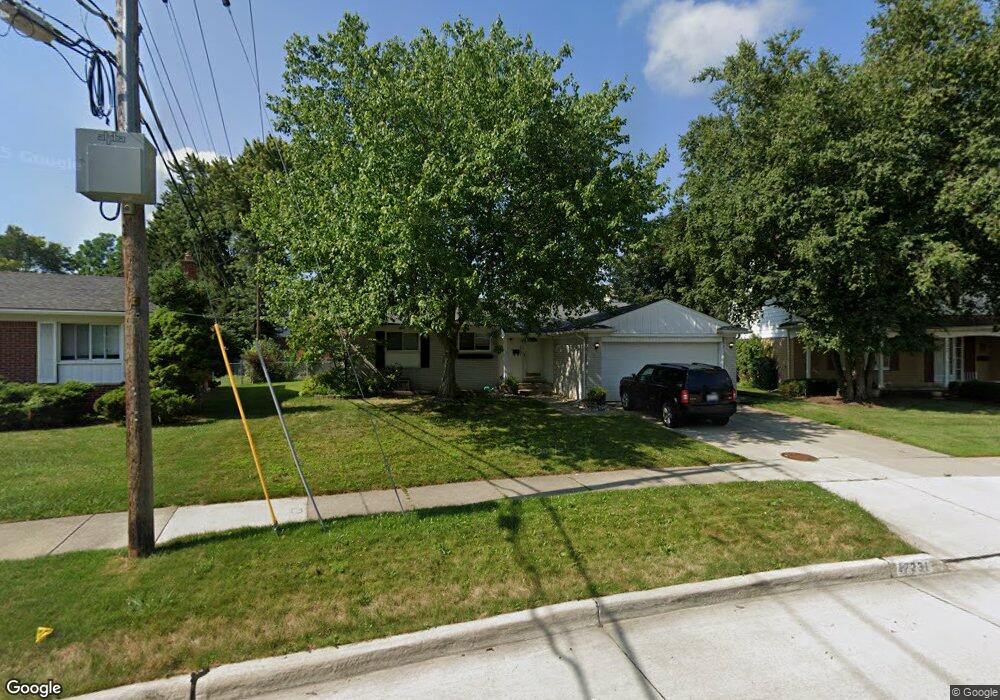
17231 Doris St Livonia, MI 48152
Estimated Value: $343,000 - $369,000
3
Beds
2
Baths
1,292
Sq Ft
$272/Sq Ft
Est. Value
About This Home
This home is located at 17231 Doris St, Livonia, MI 48152 and is currently estimated at $351,795, approximately $272 per square foot. 17231 Doris St is a home located in Wayne County with nearby schools including Riley Upper Elementary School, Coolidge Elementary School, and Webster Elementary School.
Ownership History
Date
Name
Owned For
Owner Type
Purchase Details
Closed on
Jul 24, 2013
Sold by
Mosier Bethany J
Bought by
Mosier Bethany J and Garbutt Jacob
Current Estimated Value
Home Financials for this Owner
Home Financials are based on the most recent Mortgage that was taken out on this home.
Original Mortgage
$85,400
Outstanding Balance
$63,745
Interest Rate
4.56%
Mortgage Type
New Conventional
Estimated Equity
$288,050
Purchase Details
Closed on
Apr 13, 2011
Sold by
Secretary Of Housing & Urban Development
Bought by
Mosier Bethany J
Purchase Details
Closed on
Jan 6, 2011
Sold by
Wells Fargo Bank Na
Bought by
The Secretary Of Housing & Urban Develop
Purchase Details
Closed on
Jun 23, 2010
Sold by
Stewart Mark and Klosowski Stacey
Bought by
Wells Fargo Bank Na
Purchase Details
Closed on
Apr 9, 2003
Sold by
Vensko Ronald and Schryer Vensko Dorene
Bought by
Stewart Mark R
Purchase Details
Closed on
Sep 29, 1995
Sold by
Vensko Ronald and Vensko Dorene S
Bought by
Ronald Vensko and Ronald Dorene Schryer
Create a Home Valuation Report for This Property
The Home Valuation Report is an in-depth analysis detailing your home's value as well as a comparison with similar homes in the area
Home Values in the Area
Average Home Value in this Area
Purchase History
| Date | Buyer | Sale Price | Title Company |
|---|---|---|---|
| Mosier Bethany J | -- | First American Title Ins Co | |
| Mosier Bethany J | $87,000 | None Available | |
| The Secretary Of Housing & Urban Develop | -- | None Available | |
| Wells Fargo Bank Na | $168,139 | None Available | |
| Stewart Mark R | $270,000 | Golden Title | |
| Ronald Vensko | $131,000 | -- |
Source: Public Records
Mortgage History
| Date | Status | Borrower | Loan Amount |
|---|---|---|---|
| Open | Mosier Bethany J | $85,400 |
Source: Public Records
Tax History Compared to Growth
Tax History
| Year | Tax Paid | Tax Assessment Tax Assessment Total Assessment is a certain percentage of the fair market value that is determined by local assessors to be the total taxable value of land and additions on the property. | Land | Improvement |
|---|---|---|---|---|
| 2025 | $2,185 | $171,800 | $0 | $0 |
| 2024 | $2,185 | $158,200 | $0 | $0 |
| 2023 | $2,085 | $144,300 | $0 | $0 |
| 2022 | $3,660 | $131,500 | $0 | $0 |
| 2021 | $3,555 | $124,100 | $0 | $0 |
| 2019 | $2,670 | $90,900 | $0 | $0 |
| 2018 | $1,380 | $84,000 | $0 | $0 |
| 2017 | $2,008 | $81,400 | $0 | $0 |
| 2016 | $2,535 | $78,900 | $0 | $0 |
| 2015 | $6,136 | $69,570 | $0 | $0 |
| 2012 | -- | $58,060 | $17,700 | $40,360 |
Source: Public Records
Map
Nearby Homes
- 29945 6 Mile Rd
- 29836 Bobrich St
- 30115 Munger Dr
- 30425 Munger Dr
- 31366 Mayville St
- 31069 Munger Dr
- 29721 Pickford St
- 18659 Flamingo Blvd
- 18725 Flamingo Blvd
- 18872 Hillcrest St
- 29560 Clarita St Unit 11
- 30285 7 Mile Rd
- 15608 Hidden Ln
- 19021 Merriman Rd
- 29106 Broadmoor St
- 18061 Lathers St
- 31005 Roycroft St
- 18496 Brentwood St
- 15345 Bainbridge St
- 18001 Floral St
- 17245 Doris St
- 17207 Doris St
- 17200 Catherine Ct
- 17187 Stamwich St
- 17220 Catherine Ct
- 17259 Doris St
- 17240 Doris St
- 17173 Stamwich St
- 17180 Catherine Ct
- 17231 Stamwich St
- 17306 Doris St
- 17195 Catherine Ct
- 17161 Stamwich St
- 17309 Doris St
- 17255 Stamwich St
- 17326 Doris St
- 17160 Catherine Ct
- 17149 Stamwich St
- 17175 Catherine Ct
- 17323 Doris St