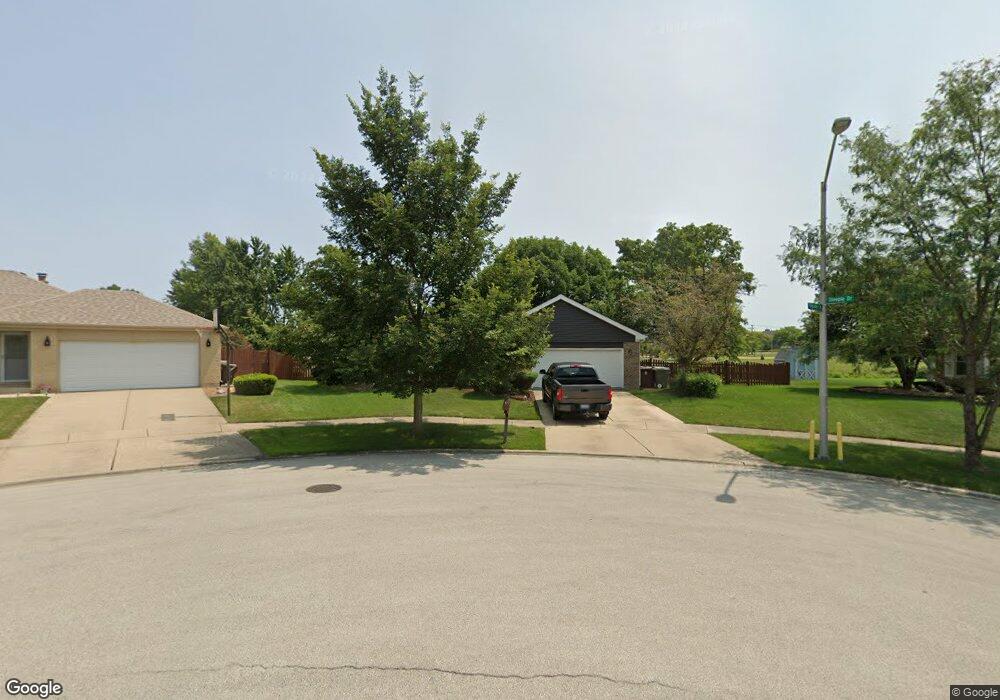
17237 Fox Grove Ln Tinley Park, IL 60487
Central Tinley Park NeighborhoodEstimated Value: $321,000 - $368,704
3
Beds
2
Baths
1,201
Sq Ft
$285/Sq Ft
Est. Value
About This Home
This home is located at 17237 Fox Grove Ln, Tinley Park, IL 60487 and is currently estimated at $342,176, approximately $284 per square foot. 17237 Fox Grove Ln is a home located in Cook County with nearby schools including Christa Mcauliffe School, Prairie View Middle School, and Victor J Andrew High School.
Ownership History
Date
Name
Owned For
Owner Type
Purchase Details
Closed on
May 9, 2005
Sold by
Petersen George H and Petersen Sarah
Bought by
Piekarz Tkalec Donna M
Current Estimated Value
Home Financials for this Owner
Home Financials are based on the most recent Mortgage that was taken out on this home.
Original Mortgage
$220,000
Outstanding Balance
$116,400
Interest Rate
6.07%
Mortgage Type
Fannie Mae Freddie Mac
Estimated Equity
$225,776
Purchase Details
Closed on
Mar 25, 1995
Sold by
Mroz Steven D
Bought by
Petersen George H and Petersen Sarah
Home Financials for this Owner
Home Financials are based on the most recent Mortgage that was taken out on this home.
Original Mortgage
$152,000
Interest Rate
7.88%
Purchase Details
Closed on
Dec 5, 1994
Sold by
Mroz Lisa M and Czajkowski Lisa M
Bought by
Mroz Steven D
Create a Home Valuation Report for This Property
The Home Valuation Report is an in-depth analysis detailing your home's value as well as a comparison with similar homes in the area
Home Values in the Area
Average Home Value in this Area
Purchase History
| Date | Buyer | Sale Price | Title Company |
|---|---|---|---|
| Piekarz Tkalec Donna M | $172,000 | Atgf Inc | |
| Petersen George H | $169,000 | Attorneys Title Guaranty Fun | |
| Mroz Steven D | -- | -- |
Source: Public Records
Mortgage History
| Date | Status | Borrower | Loan Amount |
|---|---|---|---|
| Open | Piekarz Tkalec Donna M | $220,000 | |
| Previous Owner | Petersen George H | $152,000 |
Source: Public Records
Tax History Compared to Growth
Tax History
| Year | Tax Paid | Tax Assessment Tax Assessment Total Assessment is a certain percentage of the fair market value that is determined by local assessors to be the total taxable value of land and additions on the property. | Land | Improvement |
|---|---|---|---|---|
| 2024 | $7,964 | $32,000 | $4,640 | $27,360 |
| 2023 | $6,114 | $32,000 | $4,640 | $27,360 |
| 2022 | $6,114 | $20,571 | $4,035 | $16,536 |
| 2021 | $5,949 | $20,571 | $4,035 | $16,536 |
| 2020 | $5,871 | $20,571 | $4,035 | $16,536 |
| 2019 | $6,321 | $22,919 | $3,631 | $19,288 |
| 2018 | $6,184 | $22,919 | $3,631 | $19,288 |
| 2017 | $6,037 | $22,919 | $3,631 | $19,288 |
| 2016 | $5,682 | $19,604 | $3,228 | $16,376 |
| 2015 | $5,579 | $19,604 | $3,228 | $16,376 |
| 2014 | $5,549 | $19,604 | $3,228 | $16,376 |
| 2013 | $5,408 | $20,536 | $3,228 | $17,308 |
Source: Public Records
Map
Nearby Homes
- 17155 Kamp Ct Unit 9
- 8543 Carriage Ln
- 8548 Bethany Ln
- 8444 W 171st St
- 8456 170th Place
- 17324 Humber Ln
- 8229 170th St Unit 8229
- 8313 Aster Ln
- 16933 Richards Dr
- Fremont Plan at Radcliffe Place
- Calysta Plan at Radcliffe Place
- Danbury Plan at Radcliffe Place
- Briarcliffe Plan at Radcliffe Place
- Eden Plan at Radcliffe Place
- Amberwood Plan at Radcliffe Place
- 8721 W 169th St
- 8030 Valley View Dr
- 17003 Grissom Dr Unit 2N
- 8750 W 169th St
- 17631 Dover Ct
- 8501 Steeple Dr
- 17231 Fox Grove Ln
- 8507 Steeple Dr
- 17225 Fox Grove Ln
- 17218 Cottage Ct
- 17228 Fox Grove Ln
- 8513 Steeple Dr
- 17219 Fox Grove Ln
- 17222 Fox Grove Ln
- 8519 Steeple Dr
- 17206 Cottage Ct
- 8518 Steeple Dr
- 17219 Cottage Ct
- 17216 Fox Grove Ln
- 8455 Carriage Ln
- 8449 Carriage Ln
- 8525 Steeple Dr
- 8443 Carriage Ln
- 8524 Steeple Dr
- 8437 Carriage Ln