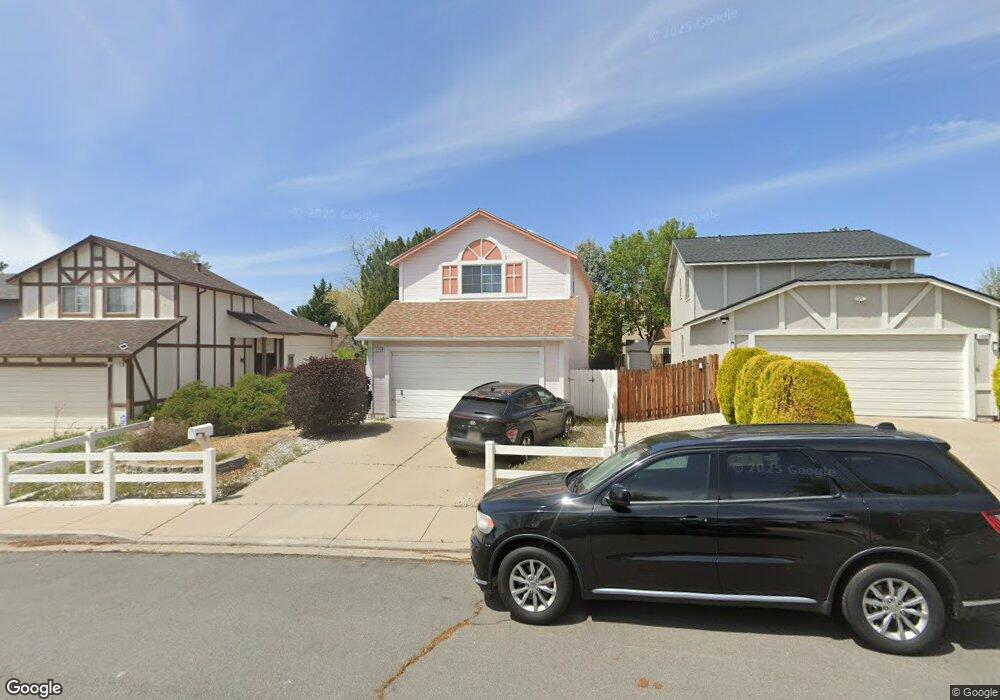
1726 Chatterly Ln Sparks, NV 89434
Reed NeighborhoodEstimated Value: $400,000 - $418,198
3
Beds
3
Baths
1,270
Sq Ft
$323/Sq Ft
Est. Value
About This Home
This home is located at 1726 Chatterly Ln, Sparks, NV 89434 and is currently estimated at $410,550, approximately $323 per square foot. 1726 Chatterly Ln is a home located in Washoe County with nearby schools including Hershal H. Beam Elementary School, Jerry Whitehead Elementary School, and Lou Mendive Middle School.
Ownership History
Date
Name
Owned For
Owner Type
Purchase Details
Closed on
Sep 12, 2022
Sold by
Bailey Barbara L
Bought by
Olson Lauren J and Olson Judith E
Current Estimated Value
Home Financials for this Owner
Home Financials are based on the most recent Mortgage that was taken out on this home.
Original Mortgage
$305,506
Outstanding Balance
$291,805
Interest Rate
5.22%
Mortgage Type
FHA
Estimated Equity
$118,745
Purchase Details
Closed on
Jan 14, 1999
Sold by
Franco Maria E
Bought by
Bailey Barbara L
Home Financials for this Owner
Home Financials are based on the most recent Mortgage that was taken out on this home.
Original Mortgage
$100,000
Interest Rate
6.63%
Create a Home Valuation Report for This Property
The Home Valuation Report is an in-depth analysis detailing your home's value as well as a comparison with similar homes in the area
Home Values in the Area
Average Home Value in this Area
Purchase History
| Date | Buyer | Sale Price | Title Company |
|---|---|---|---|
| Olson Lauren J | $362,000 | First Centennial Title | |
| Bailey Barbara L | $125,000 | Stewart Title Company |
Source: Public Records
Mortgage History
| Date | Status | Borrower | Loan Amount |
|---|---|---|---|
| Open | Olson Lauren J | $305,506 | |
| Previous Owner | Bailey Barbara L | $100,000 |
Source: Public Records
Tax History Compared to Growth
Tax History
| Year | Tax Paid | Tax Assessment Tax Assessment Total Assessment is a certain percentage of the fair market value that is determined by local assessors to be the total taxable value of land and additions on the property. | Land | Improvement |
|---|---|---|---|---|
| 2025 | $1,804 | $70,862 | $34,314 | $36,548 |
| 2024 | $1,804 | $68,672 | $31,554 | $37,118 |
| 2023 | $1,753 | $68,838 | $33,416 | $35,422 |
| 2022 | $1,624 | $55,129 | $25,403 | $29,726 |
| 2021 | $1,578 | $50,430 | $20,648 | $29,782 |
| 2020 | $1,530 | $49,719 | $19,684 | $30,035 |
| 2019 | $1,486 | $48,885 | $19,684 | $29,201 |
| 2018 | $1,439 | $42,525 | $13,732 | $28,793 |
| 2017 | $1,400 | $42,037 | $13,034 | $29,003 |
| 2016 | $1,365 | $41,439 | $11,638 | $29,801 |
| 2015 | $1,362 | $39,717 | $9,809 | $29,908 |
| 2014 | $1,323 | $37,415 | $8,579 | $28,836 |
| 2013 | -- | $35,129 | $6,517 | $28,612 |
Source: Public Records
Map
Nearby Homes
- 3222 Myles Dr
- 3253 Clan Alpine Dr
- 3127 Montezuma Way
- 1688 Round Mountain Cir
- 3345 Groom Way
- 2763 Blossom View Dr
- 2688 Laguna Way
- 2479 Napoli Dr
- 2372 Napoli Dr
- 2535 Tuscan Way
- 1557 Satellite Dr
- 2252 Sycamore Glen Dr
- 2407 Sunny Slope Dr Unit 1
- 2435 Sycamore Glen Dr Unit 2
- 2411 Tecumseh Way Unit 12
- 2415 Tecumseh Way Unit 11
- 3375 Culpepper Dr
- 1790 Desert Mountain Dr
- 1035 Baywood Dr Unit D
- 1792 Braidwood Dr
- 1726 Chatterley Ln
- 1720 Chatterly Ln
- 1732 Chatterly Ln
- 3254 Danville Dr
- 1714 Chatterly Ln
- 3244 Danville Dr
- 1738 Chatterly Ln
- 3234 Danville Dr
- 1708 Chatterley Ln
- 1708 Chatterly Ln
- 3264 Danville Dr
- 3224 Danville Dr
- 1744 Chatterly Ln
- 1731 Chatterley Ln
- 1731 Chatterly Ln
- 1702 Chatterly Ln
- 3274 Danville Dr
- 1719 Chatterly Ln
- 1737 Chatterley Ln
- 1737 Chatterly Ln