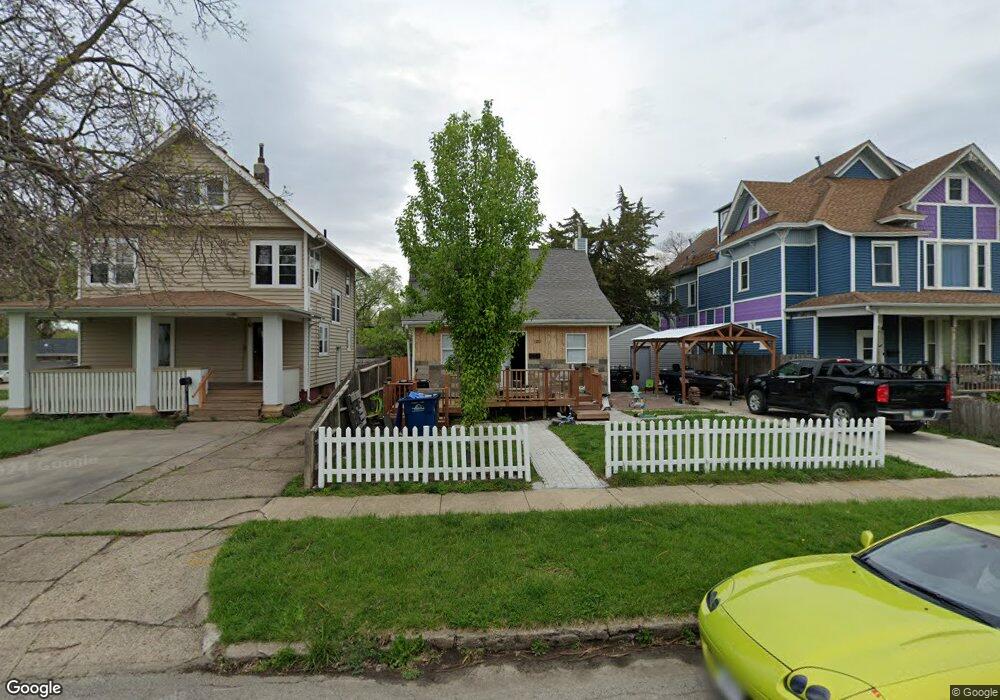
1727 10th St Des Moines, IA 50314
River Bend NeighborhoodEstimated Value: $111,000 - $136,000
2
Beds
1
Bath
775
Sq Ft
$157/Sq Ft
Est. Value
About This Home
This home is located at 1727 10th St, Des Moines, IA 50314 and is currently estimated at $121,834, approximately $157 per square foot. 1727 10th St is a home located in Polk County with nearby schools including Moulton Elementary School, Harding Middle School, and North High School.
Ownership History
Date
Name
Owned For
Owner Type
Purchase Details
Closed on
Apr 21, 2025
Sold by
Vu Lam
Bought by
Truong Nhi
Current Estimated Value
Purchase Details
Closed on
Sep 19, 2024
Sold by
Nguyen Cuong
Bought by
Vu Lam
Purchase Details
Closed on
Aug 21, 2017
Sold by
Pham Cuong C and Vo Qui
Bought by
Nguyen Cuong
Purchase Details
Closed on
Sep 12, 2011
Sold by
Pham Cuong C and Vo Qui
Bought by
Nguyen Cuong
Home Financials for this Owner
Home Financials are based on the most recent Mortgage that was taken out on this home.
Original Mortgage
$42,500
Interest Rate
4.22%
Mortgage Type
Seller Take Back
Purchase Details
Closed on
Jun 16, 2009
Sold by
Pham Cuong and Vo Qui
Bought by
Pham Cuong and Vo Qui
Purchase Details
Closed on
Apr 1, 2005
Sold by
Ho Gieng and Duong Muoi Tu
Bought by
Pham Cuong Cao and Vo Qui Thi
Create a Home Valuation Report for This Property
The Home Valuation Report is an in-depth analysis detailing your home's value as well as a comparison with similar homes in the area
Home Values in the Area
Average Home Value in this Area
Purchase History
| Date | Buyer | Sale Price | Title Company |
|---|---|---|---|
| Truong Nhi | -- | None Listed On Document | |
| Truong Nhi | -- | None Listed On Document | |
| Vu Lam | -- | None Listed On Document | |
| Nguyen Cuong | $45,000 | None Available | |
| Nguyen Cuong | $45,000 | None Available | |
| Pham Cuong | -- | None Available | |
| Pham Cuong Cao | -- | -- |
Source: Public Records
Mortgage History
| Date | Status | Borrower | Loan Amount |
|---|---|---|---|
| Previous Owner | Nguyen Cuong | $42,500 |
Source: Public Records
Tax History Compared to Growth
Tax History
| Year | Tax Paid | Tax Assessment Tax Assessment Total Assessment is a certain percentage of the fair market value that is determined by local assessors to be the total taxable value of land and additions on the property. | Land | Improvement |
|---|---|---|---|---|
| 2025 | $1,502 | $98,100 | $13,600 | $84,500 |
| 2024 | $1,502 | $76,310 | $11,600 | $64,710 |
| 2023 | $1,254 | $83,900 | $11,600 | $72,300 |
| 2022 | $1,244 | $60,800 | $8,800 | $52,000 |
| 2021 | $1,158 | $60,800 | $8,800 | $52,000 |
| 2020 | $1,204 | $54,000 | $7,800 | $46,200 |
| 2019 | $1,128 | $54,000 | $7,800 | $46,200 |
| 2018 | $1,118 | $42,000 | $7,000 | $35,000 |
| 2017 | $1,136 | $42,000 | $7,000 | $35,000 |
| 2016 | $1,106 | $42,000 | $7,000 | $35,000 |
| 2015 | $1,106 | $42,000 | $7,000 | $35,000 |
| 2014 | $1,044 | $39,300 | $7,200 | $32,100 |
Source: Public Records
Map
Nearby Homes