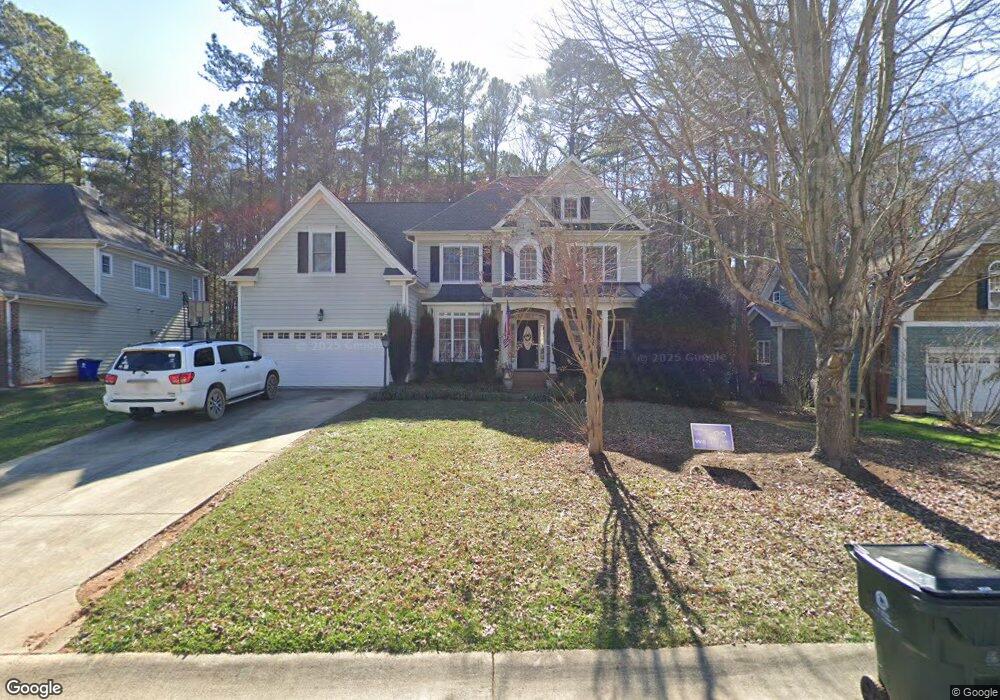
173 Chatham Mill Rd Pittsboro, NC 27312
Estimated Value: $501,248 - $530,000
4
Beds
3
Baths
2,600
Sq Ft
$198/Sq Ft
Est. Value
About This Home
This home is located at 173 Chatham Mill Rd, Pittsboro, NC 27312 and is currently estimated at $514,562, approximately $197 per square foot. 173 Chatham Mill Rd is a home located in Chatham County with nearby schools including Pittsboro Elementary School, George Moses Horton Middle School, and Northwood High.
Ownership History
Date
Name
Owned For
Owner Type
Purchase Details
Closed on
Apr 18, 2023
Sold by
Etz Chayim Trust
Bought by
Vansweden Paul and Vansweden Mirenda
Current Estimated Value
Home Financials for this Owner
Home Financials are based on the most recent Mortgage that was taken out on this home.
Original Mortgage
$50,000
Interest Rate
5.76%
Purchase Details
Closed on
Apr 15, 2011
Sold by
Sparks Jonathan D and Sparks Amanda L
Bought by
Vansweden Paul and Vansweden Miranda Ann
Home Financials for this Owner
Home Financials are based on the most recent Mortgage that was taken out on this home.
Original Mortgage
$225,000
Interest Rate
4.5%
Mortgage Type
New Conventional
Create a Home Valuation Report for This Property
The Home Valuation Report is an in-depth analysis detailing your home's value as well as a comparison with similar homes in the area
Home Values in the Area
Average Home Value in this Area
Purchase History
| Date | Buyer | Sale Price | Title Company |
|---|---|---|---|
| Vansweden Paul | $120,000 | None Listed On Document | |
| Vansweden Paul | $250,000 | None Listed On Document | |
| Vansweden Paul | $225,000 | None Available |
Source: Public Records
Mortgage History
| Date | Status | Borrower | Loan Amount |
|---|---|---|---|
| Closed | Vansweden Paul | $50,000 | |
| Open | Vansweden Paul | $187,500 | |
| Closed | Vansweden Paul | $187,500 | |
| Previous Owner | Vansweden Paul | $225,000 | |
| Closed | Vansweden Paul | $50,000 |
Source: Public Records
Tax History Compared to Growth
Tax History
| Year | Tax Paid | Tax Assessment Tax Assessment Total Assessment is a certain percentage of the fair market value that is determined by local assessors to be the total taxable value of land and additions on the property. | Land | Improvement |
|---|---|---|---|---|
| 2025 | $5,117 | $468,504 | $70,950 | $397,554 |
| 2024 | $5,117 | $302,911 | $64,500 | $238,411 |
| 2023 | $3,764 | $302,911 | $64,500 | $238,411 |
| 2022 | $3,557 | $302,911 | $64,500 | $238,411 |
| 2021 | $3,527 | $302,911 | $64,500 | $238,411 |
| 2020 | $3,167 | $269,354 | $46,350 | $223,004 |
| 2019 | $3,157 | $269,354 | $46,350 | $223,004 |
| 2018 | $3,024 | $269,354 | $46,350 | $223,004 |
| 2017 | $3,024 | $269,354 | $46,350 | $223,004 |
| 2016 | $2,959 | $261,810 | $45,000 | $216,810 |
| 2015 | $2,928 | $261,810 | $45,000 | $216,810 |
| 2014 | $2,928 | $261,810 | $45,000 | $216,810 |
| 2013 | -- | $261,810 | $45,000 | $216,810 |
Source: Public Records
Map
Nearby Homes
- 24 Cynthia Ln
- Tbd Versailles Ln
- 298 E Salisbury St
- 41 Cottage Way
- 17 Plenty Ct
- 54 Pattishall Rd
- 726 Thompson St
- 116 Kensington Dr
- 186 Millennium Dr
- 425 Credle St
- 66 Toomer Loop Rd
- 25 Juleann Ln
- 162 Gaines Trail
- 142 Autumn Gate St
- 1157 Hillsboro St
- 710 Vine Pkwy
- 230 Oakwood Dr
- 53 Circle City Way
- 122 Norwell Ln
- 155 Norwell Ln
- 189 Chatham Mill Rd
- 157 Chatham Mill Rd
- 199 Chatham Mill Rd
- 147 Chatham Mill Rd
- 170 Chatham Mill Rd
- 182 Chatham Mill Rd
- 192 Chatham Mill Rd
- 23 Bellemont Ridge Rd
- 133 Chatham Mill Rd
- 223 Chatham Mill Rd
- Lot#28 Chatham Mill Rd Unit 28
- Lot#27 Chatham Mill Rd Unit 27
- Lot#29 Chatham Mill Rd Unit 29
- Lot#31 Chatham Mill Rd Unit 31
- lot 29 Chatham Mill Rd Unit 29
- lot 27 Chatham Mill Rd Unit 27
- lot 28 Chatham Mill Rd Unit 28
- 208 Chatham Mill Rd
- 35 Bellemont Ridge Rd
- 23 Bellemont Rd