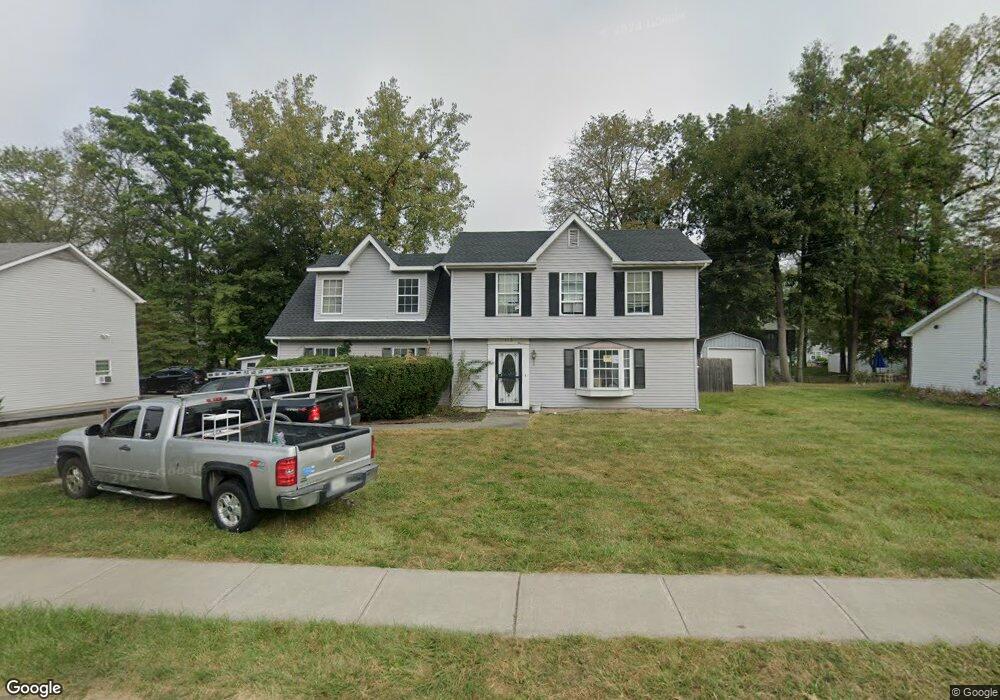
173 Fulton St Poughkeepsie, NY 12601
Estimated Value: $326,000 - $436,000
4
Beds
3
Baths
2,163
Sq Ft
$188/Sq Ft
Est. Value
About This Home
This home is located at 173 Fulton St, Poughkeepsie, NY 12601 and is currently estimated at $406,116, approximately $187 per square foot. 173 Fulton St is a home located in Dutchess County with nearby schools including Franklin D Roosevelt Senior High School and Faith Christian Academy.
Ownership History
Date
Name
Owned For
Owner Type
Purchase Details
Closed on
Sep 4, 2024
Sold by
Nesheiwat Llc
Bought by
Alshloul Issa Y
Current Estimated Value
Home Financials for this Owner
Home Financials are based on the most recent Mortgage that was taken out on this home.
Original Mortgage
$336,000
Outstanding Balance
$332,223
Interest Rate
6.47%
Mortgage Type
Purchase Money Mortgage
Estimated Equity
$73,893
Purchase Details
Closed on
Apr 5, 2005
Sold by
Stewart Abraham L Gwendolyn
Bought by
Nesheiwat Firas E
Create a Home Valuation Report for This Property
The Home Valuation Report is an in-depth analysis detailing your home's value as well as a comparison with similar homes in the area
Home Values in the Area
Average Home Value in this Area
Purchase History
| Date | Buyer | Sale Price | Title Company |
|---|---|---|---|
| Alshloul Issa Y | $336,000 | None Available | |
| Nesheiwat Firas E | $294,525 | Firas E Nesheiwat | |
| Nesheiwat Firas E | $294,525 | Firas E Nesheiwat |
Source: Public Records
Mortgage History
| Date | Status | Borrower | Loan Amount |
|---|---|---|---|
| Open | Alshloul Issa Y | $336,000 |
Source: Public Records
Tax History Compared to Growth
Tax History
| Year | Tax Paid | Tax Assessment Tax Assessment Total Assessment is a certain percentage of the fair market value that is determined by local assessors to be the total taxable value of land and additions on the property. | Land | Improvement |
|---|---|---|---|---|
| 2024 | $11,141 | $324,000 | $63,800 | $260,200 |
| 2023 | $12,425 | $324,000 | $63,800 | $260,200 |
| 2022 | $11,300 | $279,000 | $58,000 | $221,000 |
| 2021 | $11,136 | $242,500 | $58,000 | $184,500 |
| 2020 | $8,058 | $226,500 | $58,000 | $168,500 |
| 2019 | $8,108 | $226,500 | $58,000 | $168,500 |
| 2018 | $8,249 | $226,500 | $58,000 | $168,500 |
| 2017 | $8,182 | $224,000 | $58,000 | $166,000 |
| 2016 | $8,486 | $227,000 | $58,000 | $169,000 |
| 2015 | -- | $231,000 | $58,000 | $173,000 |
| 2014 | -- | $231,000 | $58,000 | $173,000 |
Source: Public Records
Map
Nearby Homes