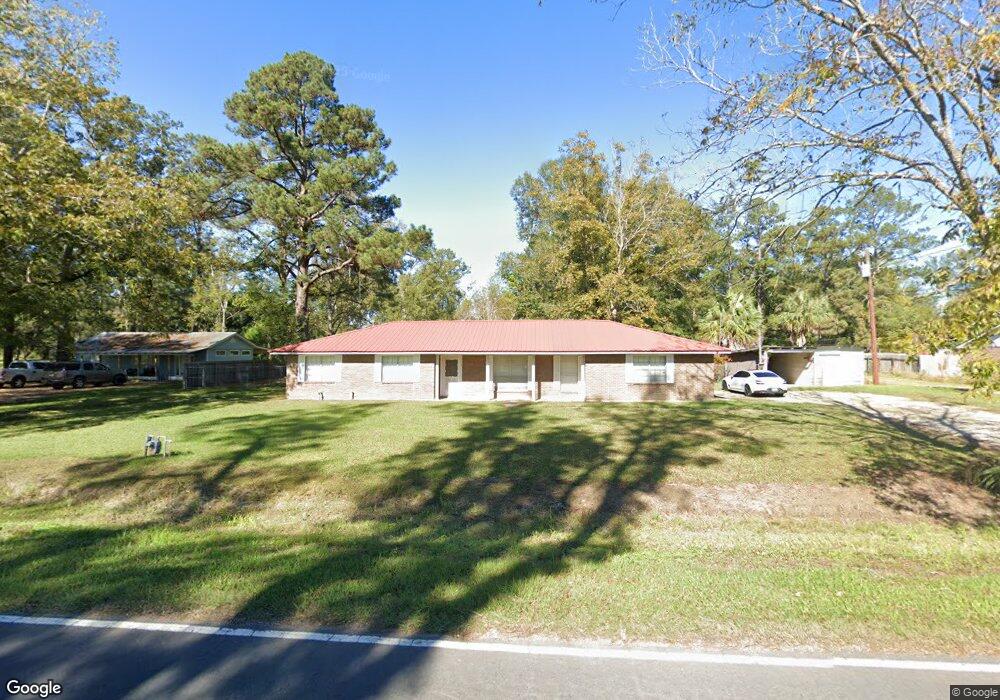
17335 E Little Italy Rd Hammond, LA 70403
Estimated Value: $168,000 - $276,000
3
Beds
2
Baths
1,876
Sq Ft
$111/Sq Ft
Est. Value
About This Home
This home is located at 17335 E Little Italy Rd, Hammond, LA 70403 and is currently estimated at $207,803, approximately $110 per square foot. 17335 E Little Italy Rd is a home located in Tangipahoa Parish with nearby schools including Hammond Eastside Magnet, Hammond High Magnet School, and Tangi Academy.
Ownership History
Date
Name
Owned For
Owner Type
Purchase Details
Closed on
Aug 28, 2018
Sold by
Johnson Anita D
Bought by
Moore 2Nd Stephen M
Current Estimated Value
Home Financials for this Owner
Home Financials are based on the most recent Mortgage that was taken out on this home.
Original Mortgage
$92,000
Outstanding Balance
$80,237
Interest Rate
4.6%
Mortgage Type
Unknown
Estimated Equity
$127,566
Purchase Details
Closed on
Dec 27, 2006
Sold by
Baham Marissa Camille
Bought by
Johnson Jeffrey S and Johnson Anita D
Home Financials for this Owner
Home Financials are based on the most recent Mortgage that was taken out on this home.
Original Mortgage
$139,000
Interest Rate
6.27%
Mortgage Type
Future Advance Clause Open End Mortgage
Create a Home Valuation Report for This Property
The Home Valuation Report is an in-depth analysis detailing your home's value as well as a comparison with similar homes in the area
Home Values in the Area
Average Home Value in this Area
Purchase History
| Date | Buyer | Sale Price | Title Company |
|---|---|---|---|
| Moore 2Nd Stephen M | $115,000 | -- | |
| Johnson Jeffrey S | $125,000 | None Available |
Source: Public Records
Mortgage History
| Date | Status | Borrower | Loan Amount |
|---|---|---|---|
| Open | Moore 2Nd Stephen M | $92,000 | |
| Previous Owner | Johnson Jeffrey S | $139,000 |
Source: Public Records
Tax History Compared to Growth
Tax History
| Year | Tax Paid | Tax Assessment Tax Assessment Total Assessment is a certain percentage of the fair market value that is determined by local assessors to be the total taxable value of land and additions on the property. | Land | Improvement |
|---|---|---|---|---|
| 2024 | $1,269 | $10,551 | $1,512 | $9,039 |
| 2023 | $1,318 | $10,885 | $1,400 | $9,485 |
| 2022 | $1,318 | $10,885 | $1,400 | $9,485 |
| 2021 | $1,324 | $10,885 | $1,400 | $9,485 |
| 2020 | $1,318 | $10,885 | $1,400 | $9,485 |
| 2019 | $1,304 | $10,885 | $1,400 | $9,485 |
| 2018 | $1,406 | $11,707 | $1,400 | $10,307 |
| 2017 | $1,418 | $11,707 | $1,400 | $10,307 |
| 2016 | $1,406 | $11,707 | $1,400 | $10,307 |
| 2015 | $579 | $12,313 | $1,400 | $10,913 |
| 2014 | $560 | $12,313 | $1,400 | $10,913 |
Source: Public Records
Map
Nearby Homes
- 43153 N Little Italy Rd
- 43126 Pecan Ridge Dr
- 43448 Springwood Way
- 43232 S Range Rd
- 43480 N Little Italy Rd
- 43485 Mclain Ln
- Lot 5-A E Pleasant Ridge Rd
- 17351 Old Covington Hwy
- 43439 Springwood Way
- 43503 Springwood Way
- 43485 Springwood Way
- 17142 Parker Ln
- 16195 E Minnesota Park Rd
- 7.55ACRES E Club Deluxe Rd
- 42548 S Range Rd
- 17198 Bridle Path None
- 17198 Bridle Path
- 16201 Stellar Ln
- 17347 E Little Italy Rd
- 17330 E Little Italy Rd
- 17325 E Little Italy Rd
- 17368 E Little Italy Rd
- 43153 N Little Italy Rd
- 17286 E Little Italy Rd
- 17289 E Little Italy Rd
- 17289 E Little Italy Rd
- 17340 Vutera Dr
- 17350 Vutera Dr
- 17330 Vutera Dr
- 17362 Vutera Dr
- 17322 Vutera Dr
- 17314 Vutera Dr
- 17277 E Little Italy Rd
- 43150 N Little Italy Rd
- 17274 E Little Italy Rd
- 17388 Vutera Dr
- 17308 Vutera Dr
- 43160 N Little Italy Rd