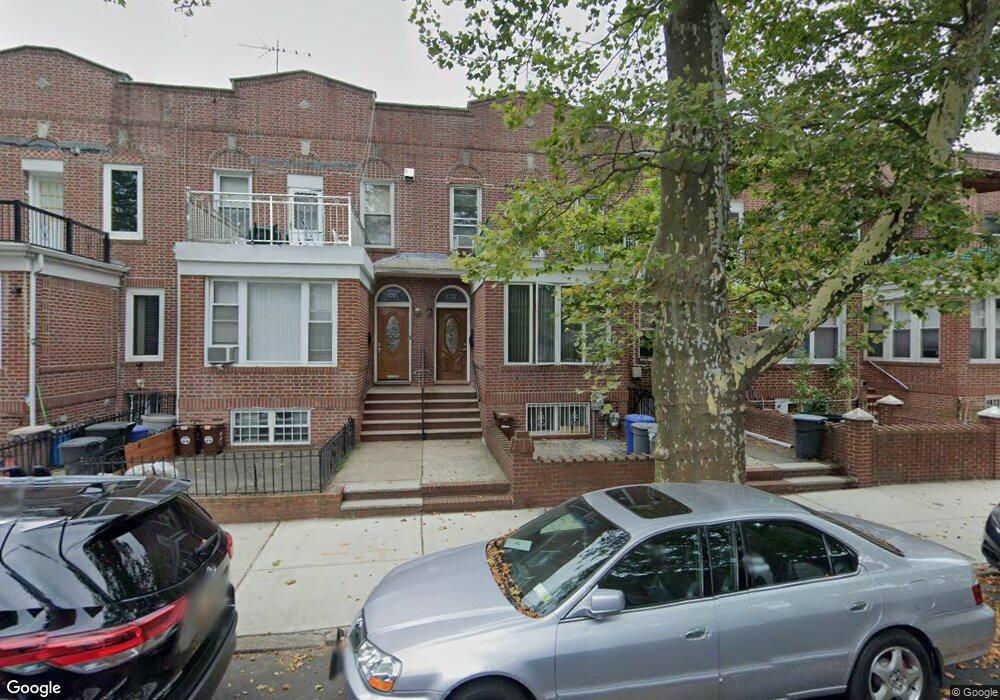
1737 W 1st St Brooklyn, NY 11223
Gravesend NeighborhoodEstimated Value: $1,019,000 - $1,843,000
--
Bed
--
Bath
1,507
Sq Ft
$901/Sq Ft
Est. Value
About This Home
This home is located at 1737 W 1st St, Brooklyn, NY 11223 and is currently estimated at $1,357,072, approximately $900 per square foot. 1737 W 1st St is a home located in Kings County with nearby schools including P.S.177 The Marlboro, Is 228 David A Boody, and Coney Island Preparatory Public Charter School.
Ownership History
Date
Name
Owned For
Owner Type
Purchase Details
Closed on
Oct 16, 2012
Sold by
Cheung Shui Fun and Cheung Susan
Bought by
Kuang Cai Zhen Lau-
Current Estimated Value
Home Financials for this Owner
Home Financials are based on the most recent Mortgage that was taken out on this home.
Original Mortgage
$417,000
Outstanding Balance
$289,438
Interest Rate
3.56%
Mortgage Type
New Conventional
Estimated Equity
$1,067,634
Purchase Details
Closed on
Nov 25, 1997
Sold by
Aluzzo Gasper
Bought by
Cheung Shui Fun and Cheung Susan
Home Financials for this Owner
Home Financials are based on the most recent Mortgage that was taken out on this home.
Original Mortgage
$60,000
Interest Rate
7.08%
Purchase Details
Closed on
Jun 28, 1997
Sold by
Alozzo Antonio
Bought by
Aluzzo Antonio and Aluzzo Gasper
Create a Home Valuation Report for This Property
The Home Valuation Report is an in-depth analysis detailing your home's value as well as a comparison with similar homes in the area
Home Values in the Area
Average Home Value in this Area
Purchase History
| Date | Buyer | Sale Price | Title Company |
|---|---|---|---|
| Kuang Cai Zhen Lau- | $635,000 | -- | |
| Kuang Cai Zhen Lau- | $635,000 | -- | |
| Cheung Shui Fun | $180,000 | -- | |
| Cheung Shui Fun | $180,000 | -- | |
| Aluzzo Antonio | -- | -- | |
| Aluzzo Antonio | -- | -- |
Source: Public Records
Mortgage History
| Date | Status | Borrower | Loan Amount |
|---|---|---|---|
| Open | Kuang Cai Zhen Lau- | $417,000 | |
| Closed | Kuang Cai Zhen Lau- | $417,000 | |
| Previous Owner | Cheung Shui Fun | $60,000 |
Source: Public Records
Tax History Compared to Growth
Tax History
| Year | Tax Paid | Tax Assessment Tax Assessment Total Assessment is a certain percentage of the fair market value that is determined by local assessors to be the total taxable value of land and additions on the property. | Land | Improvement |
|---|---|---|---|---|
| 2025 | $7,513 | $87,480 | $14,880 | $72,600 |
| 2024 | $7,513 | $69,120 | $14,880 | $54,240 |
| 2023 | $7,247 | $80,100 | $14,880 | $65,220 |
| 2022 | $6,781 | $65,580 | $14,880 | $50,700 |
| 2021 | $6,786 | $68,940 | $14,880 | $54,060 |
| 2020 | $3,373 | $57,600 | $14,880 | $42,720 |
| 2019 | $6,520 | $46,140 | $14,880 | $31,260 |
| 2018 | $6,062 | $29,738 | $9,666 | $20,072 |
| 2017 | $5,770 | $28,305 | $7,428 | $20,877 |
| 2016 | $5,372 | $26,872 | $9,520 | $17,352 |
| 2015 | $3,001 | $26,872 | $10,358 | $16,514 |
| 2014 | $3,001 | $25,975 | $10,375 | $15,600 |
Source: Public Records
Map
Nearby Homes
- 1728 W 2nd St
- 1652 Dahill Rd
- 431 Kings Hwy
- 1640 W 1st St
- 379 Kings Hwy Unit 2A
- 412 Kings Hwy Unit 6C
- 1734 E 2nd St
- 355 Kings Hwy Unit 5C
- 340 Avenue P
- 380 Avenue P
- 1806 McDonald Ave
- 339 Avenue P Unit 2B
- 339 Avenue P Unit 2A
- 1543 W 1st St Unit E8
- 1543 W 1st St Unit D1
- 1632 W 4th St
- 411 Avenue P
- 1721 W 6th St Unit 2A
- 431 Ave P Unit 407
- 1560 W 2nd St
- 1739 W 1st St
- 1741 W 1st St
- 1735 W 1st St
- 1743 W 1st St
- 1747 W 1st St
- 1733 W 1st St
- 1751 W 1st St
- 1731 W 1st St
- 1727 W 1st St
- 1753 W 1st St
- 1742 Dahill Rd Unit 3
- 1738 Dahill Rd Unit 3
- 1744 Dahill Rd Unit 3
- 1736 Dahill Rd Unit 3
- 1725 W 1st St
- 1750 Dahill Rd Unit 3
- 1732 Dahill Rd Unit 4
- 1757 W 1st St
- 1752 Dahill Rd Unit 3
- 1730 Dahill Rd Unit 3