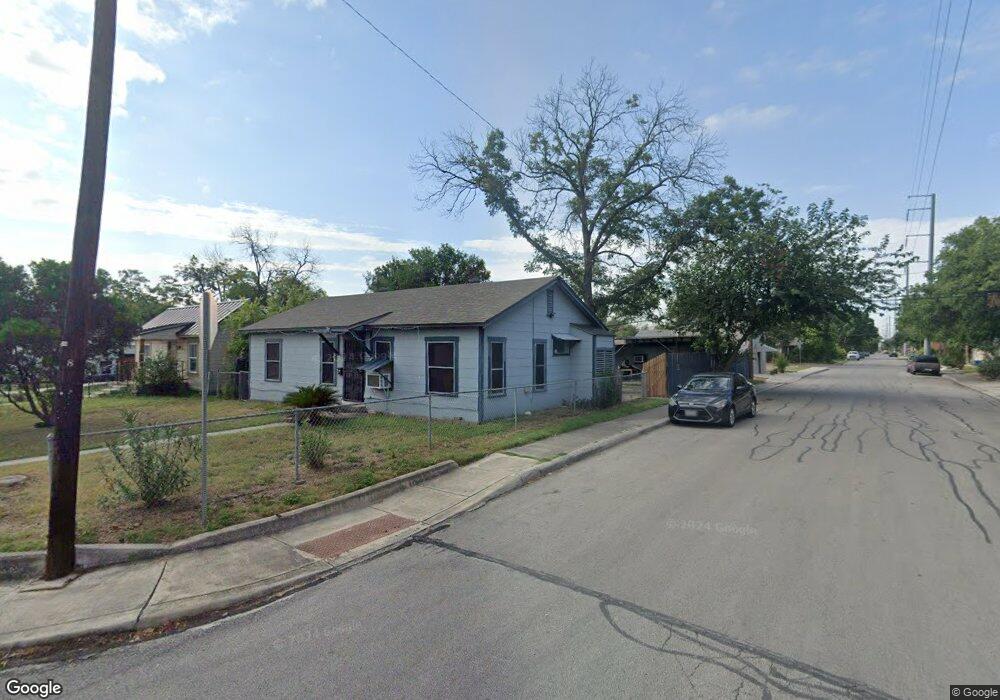
1738 Alametos San Antonio, TX 78201
Los Angeles Heights - Keystone NeighborhoodEstimated Value: $186,829 - $230,000
3
Beds
1
Bath
1,140
Sq Ft
$178/Sq Ft
Est. Value
About This Home
This home is located at 1738 Alametos, San Antonio, TX 78201 and is currently estimated at $203,457, approximately $178 per square foot. 1738 Alametos is a home located in Bexar County with nearby schools including Franklin Elementary School, Thomas Edison High School, and John Greenleaf Whittier Middle School.
Ownership History
Date
Name
Owned For
Owner Type
Purchase Details
Closed on
Aug 17, 1994
Sold by
Aguilar Ramiro and Garza Virginia
Bought by
Castro Mary Alice
Current Estimated Value
Home Financials for this Owner
Home Financials are based on the most recent Mortgage that was taken out on this home.
Original Mortgage
$18,000
Interest Rate
8.69%
Create a Home Valuation Report for This Property
The Home Valuation Report is an in-depth analysis detailing your home's value as well as a comparison with similar homes in the area
Home Values in the Area
Average Home Value in this Area
Purchase History
| Date | Buyer | Sale Price | Title Company |
|---|---|---|---|
| Castro Mary Alice | -- | -- |
Source: Public Records
Mortgage History
| Date | Status | Borrower | Loan Amount |
|---|---|---|---|
| Closed | Castro Mary Alice | $18,000 |
Source: Public Records
Tax History Compared to Growth
Tax History
| Year | Tax Paid | Tax Assessment Tax Assessment Total Assessment is a certain percentage of the fair market value that is determined by local assessors to be the total taxable value of land and additions on the property. | Land | Improvement |
|---|---|---|---|---|
| 2025 | $4,920 | $201,640 | $46,380 | $155,260 |
| 2024 | $4,920 | $201,640 | $46,380 | $155,260 |
| 2023 | $4,920 | $170,000 | $46,380 | $123,620 |
| 2022 | $5,135 | $165,000 | $42,180 | $122,820 |
| 2021 | $4,119 | $147,420 | $33,420 | $114,000 |
| 2020 | $4,075 | $136,000 | $28,770 | $107,230 |
| 2019 | $2,538 | $88,562 | $24,660 | $110,210 |
| 2018 | $2,285 | $80,511 | $20,040 | $88,260 |
| 2017 | $2,066 | $73,192 | $14,760 | $72,990 |
| 2016 | $1,878 | $66,538 | $14,760 | $67,500 |
| 2015 | $642 | $60,489 | $14,760 | $65,480 |
| 2014 | $642 | $54,990 | $0 | $0 |
Source: Public Records
Map
Nearby Homes