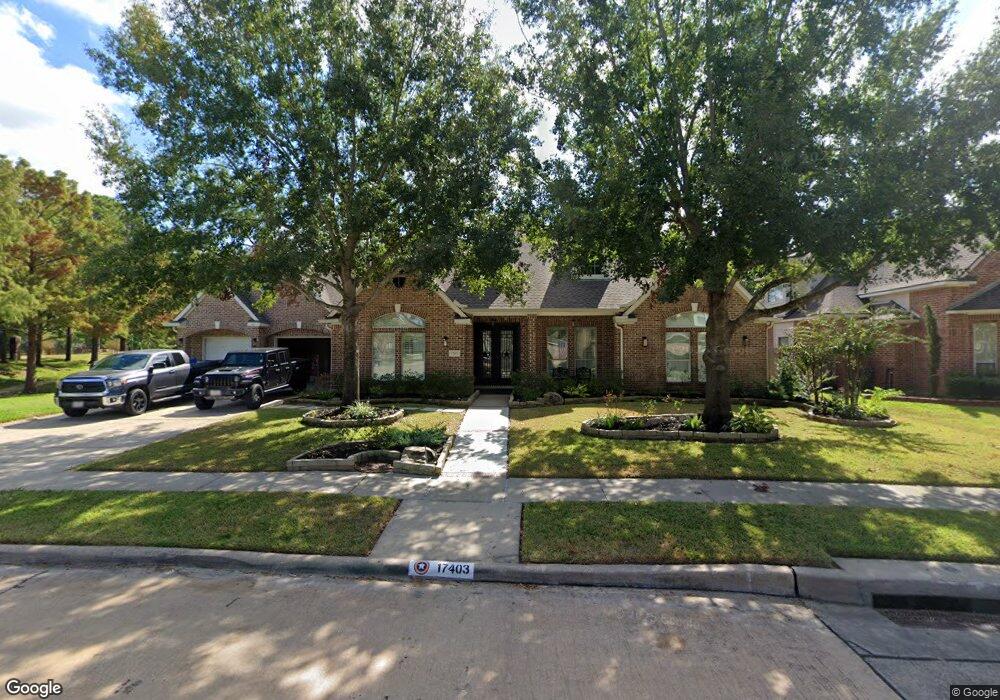
17403 Fairgrove Park Dr Houston, TX 77095
Copper Lakes NeighborhoodEstimated Value: $517,000 - $520,000
4
Beds
3
Baths
3,577
Sq Ft
$145/Sq Ft
Est. Value
About This Home
This home is located at 17403 Fairgrove Park Dr, Houston, TX 77095 and is currently estimated at $518,748, approximately $145 per square foot. 17403 Fairgrove Park Dr is a home located in Harris County with nearby schools including Copeland Elementary School, Aragon Middle School, and Langham Creek High School.
Ownership History
Date
Name
Owned For
Owner Type
Purchase Details
Closed on
Aug 10, 2021
Sold by
Ant Residential Llc
Bought by
Lopez Victor and Lopez Nelly
Current Estimated Value
Purchase Details
Closed on
Jun 3, 2021
Sold by
Dougherty Thomas and Deleon Jennifer
Bought by
Ant Residential Llc
Home Financials for this Owner
Home Financials are based on the most recent Mortgage that was taken out on this home.
Original Mortgage
$320,000
Interest Rate
2.9%
Mortgage Type
Purchase Money Mortgage
Purchase Details
Closed on
Sep 14, 2012
Sold by
Gohlke Kelli
Bought by
Dougherty Thomas and Dougherty Josefina
Purchase Details
Closed on
May 17, 2002
Sold by
Partners In Building Lp
Bought by
Gohlke Robert and Gohlke Kelli
Home Financials for this Owner
Home Financials are based on the most recent Mortgage that was taken out on this home.
Original Mortgage
$350,000
Interest Rate
6.96%
Create a Home Valuation Report for This Property
The Home Valuation Report is an in-depth analysis detailing your home's value as well as a comparison with similar homes in the area
Home Values in the Area
Average Home Value in this Area
Purchase History
| Date | Buyer | Sale Price | Title Company |
|---|---|---|---|
| Lopez Victor | -- | Select Title Llc | |
| Ant Residential Llc | -- | Select Title | |
| Dougherty Thomas | -- | None Available | |
| Gohlke Robert | -- | Texas American Title Company |
Source: Public Records
Mortgage History
| Date | Status | Borrower | Loan Amount |
|---|---|---|---|
| Previous Owner | Ant Residential Llc | $320,000 | |
| Previous Owner | Gohlke Robert | $350,000 |
Source: Public Records
Tax History Compared to Growth
Tax History
| Year | Tax Paid | Tax Assessment Tax Assessment Total Assessment is a certain percentage of the fair market value that is determined by local assessors to be the total taxable value of land and additions on the property. | Land | Improvement |
|---|---|---|---|---|
| 2025 | $11,439 | $506,692 | $93,374 | $413,318 |
| 2024 | $11,439 | $516,842 | $93,374 | $423,468 |
| 2023 | $11,439 | $555,501 | $93,374 | $462,127 |
| 2022 | $11,865 | $492,463 | $71,671 | $420,792 |
| 2021 | $10,540 | $412,783 | $71,671 | $341,112 |
| 2020 | $10,332 | $389,976 | $65,110 | $324,866 |
| 2019 | $9,877 | $361,720 | $65,110 | $296,610 |
| 2018 | $3,113 | $365,785 | $65,110 | $300,675 |
| 2017 | $10,155 | $365,785 | $65,110 | $300,675 |
| 2016 | $10,155 | $365,785 | $65,110 | $300,675 |
| 2015 | $6,225 | $365,785 | $65,110 | $300,675 |
| 2014 | $6,225 | $338,434 | $65,110 | $273,324 |
Source: Public Records
Map
Nearby Homes
- 17310 Crescent Canyon Dr
- 8507 Forest Arbor Ct
- 17603 Fairgrove Park Dr
- 8519 Sunrise Meadow Ln
- 17531 Cypress Laurel St
- 17518 Rustling Aspen Ln
- 8410 Castle Pond Ct
- 8410 Brighton Lake Ln
- 8311 Brighton Lake Ln
- 8803 Emerald Shore Ct
- 17710 Noble Oak Ct
- 8411 Sandestine Ct
- 8902 Lilac Springs
- 7807 Hickory Mill Ct
- 8823 Hollow Banks Ln
- 17215 Shallow Lake Ln
- 17814 Stoney Glade Ct
- 17414 Jade Ridge Ln
- 7626 Almond Springs Dr
- 8711 Preston Field Ln
- 17407 Fairgrove Park Dr
- 17335 Fairgrove Park Dr
- 8203 Copperas Bend Ct
- 17411 Fairgrove Park Dr
- 8202 Copperas Bend Ct
- 17414 Fairgrove Park Dr
- 8207 Copperas Bend Ct
- 17331 Fairgrove Park Dr
- 17415 Fairgrove Park Dr
- 8206 Copperas Bend Ct
- 17407 Crosscove Ct
- 17418 Fairgrove Park Dr
- 17327 Fairgrove Park Dr
- 17419 Fairgrove Park Dr
- 17402 Crosscove Ct
- 17303 Dawn Haven Ct
- 17307 Dawn Haven Ct
- 17322 Crescent Canyon Dr
- 17318 Crescent Canyon Dr
- 17311 Dawn Haven Ct