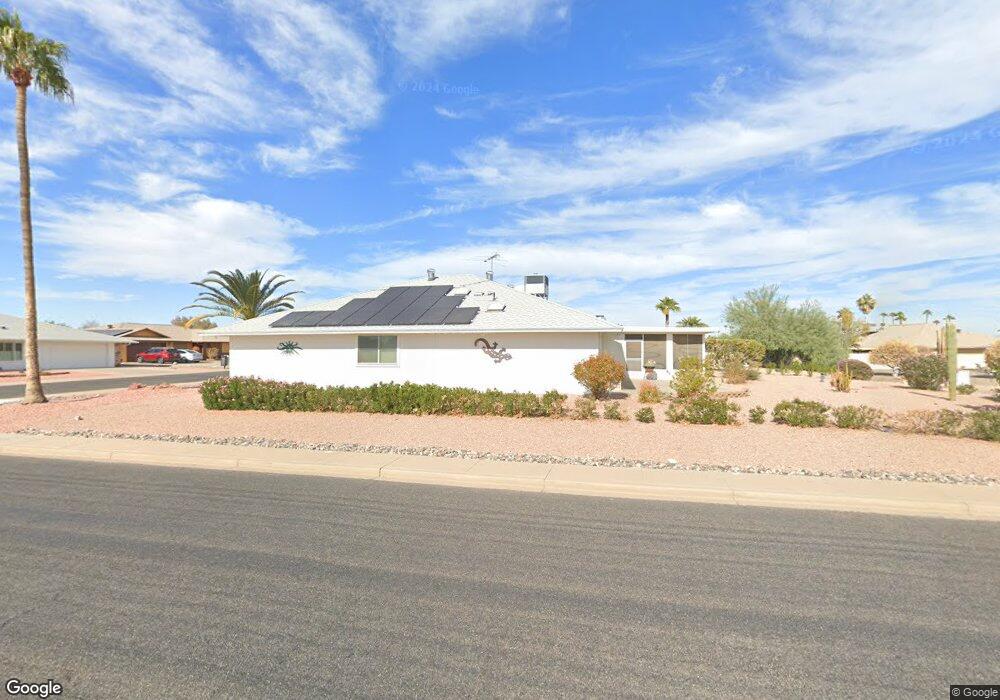
17403 N 130th Dr Sun City West, AZ 85375
Estimated Value: $322,293 - $449,000
3
Beds
2
Baths
2,500
Sq Ft
$160/Sq Ft
Est. Value
About This Home
This home is located at 17403 N 130th Dr, Sun City West, AZ 85375 and is currently estimated at $400,573, approximately $160 per square foot. 17403 N 130th Dr is a home located in Maricopa County with nearby schools including Arizona Charter Academy and FourteenSix Christian Academy.
Ownership History
Date
Name
Owned For
Owner Type
Purchase Details
Closed on
Jul 27, 2009
Sold by
Onni Peter and Onni Helen
Bought by
The Onni Family Revocable Trust
Current Estimated Value
Purchase Details
Closed on
Feb 28, 2003
Sold by
Sparks Harold A and The Sparks Family Trust
Bought by
Onni Peter and Onni Helen
Home Financials for this Owner
Home Financials are based on the most recent Mortgage that was taken out on this home.
Original Mortgage
$128,000
Outstanding Balance
$46,924
Interest Rate
3.87%
Mortgage Type
Purchase Money Mortgage
Estimated Equity
$353,649
Purchase Details
Closed on
Jan 7, 2002
Sold by
Sparks Janet A
Bought by
Sparks Harold A and The Sparks Family Trust
Purchase Details
Closed on
Dec 18, 2001
Sold by
Mcclean John A
Bought by
Thorndyke Ruby F
Purchase Details
Closed on
Dec 17, 2001
Sold by
Thorndike Ruby F
Bought by
Sparks Janet A
Create a Home Valuation Report for This Property
The Home Valuation Report is an in-depth analysis detailing your home's value as well as a comparison with similar homes in the area
Home Values in the Area
Average Home Value in this Area
Purchase History
| Date | Buyer | Sale Price | Title Company |
|---|---|---|---|
| The Onni Family Revocable Trust | -- | None Available | |
| Onni Peter | -- | North American Title Co | |
| Sparks Harold A | -- | Chicago Title Insurance Co | |
| Thorndyke Ruby F | -- | Chicago Title Insurance Co | |
| Sparks Janet A | $125,000 | Chicago Title Insurance Co |
Source: Public Records
Mortgage History
| Date | Status | Borrower | Loan Amount |
|---|---|---|---|
| Open | Onni Peter | $128,000 |
Source: Public Records
Tax History Compared to Growth
Tax History
| Year | Tax Paid | Tax Assessment Tax Assessment Total Assessment is a certain percentage of the fair market value that is determined by local assessors to be the total taxable value of land and additions on the property. | Land | Improvement |
|---|---|---|---|---|
| 2025 | $1,408 | $19,392 | -- | -- |
| 2024 | $1,402 | $19,392 | -- | -- |
| 2023 | $1,402 | $29,980 | $5,990 | $23,990 |
| 2022 | $1,313 | $24,120 | $4,820 | $19,300 |
| 2021 | $1,369 | $22,050 | $4,410 | $17,640 |
| 2020 | $1,335 | $20,700 | $4,140 | $16,560 |
| 2019 | $1,006 | $18,280 | $3,650 | $14,630 |
| 2018 | $1,016 | $12,270 | $2,450 | $9,820 |
| 2017 | $1,027 | $12,270 | $2,450 | $9,820 |
| 2016 | $633 | $12,270 | $2,450 | $9,820 |
| 2015 | $1,040 | $12,270 | $2,450 | $9,820 |
Source: Public Records
Map
Nearby Homes
- 17406 N 130th Ave
- 17415 N 130th Ave
- 17602 N Desert Glen Dr
- 13043 W Whispering Oaks Dr
- 13038 W Foxfire Dr
- 17405 N Conquistador Dr
- 12646 W Butterfield Dr
- 17409 N Conquistador Dr
- 13046 W Skyview Dr
- 17610 N Buntline Dr
- 12618 W Butterfield Dr
- 17602 N 131st Dr
- 12910 W Rampart Dr
- 17010 N 127th Dr
- 17615 N Whispering Oaks Dr
- 12514 W Butterfield Dr
- 18007 N 129th Ave
- 17646 N Whispering Oaks Dr
- 18203 N 130th Ave Unit 8
- 17807 N 125th Dr
- 17402 N 130th Ave
- 17411 N 130th Dr
- 17402 N 130th Dr
- 13007 W Whispering Oaks Dr
- 13011 W Whispering Oaks Dr
- 17410 N 130th Ave
- 17406 N 130th Dr
- 17226 N 130th Ave
- 13015 W Whispering Oaks Dr
- 17414 N 130th Dr
- 17414 N 130th Ave
- 13019 W Whispering Oaks Dr
- 17410 N 130th Dr
- 17222 N 130th Ave
- 13026 W Whispering Oaks Dr Unit 9
- 17403 N 130th Ave
- 17215 N 130th Dr
- 17418 N 130th Ave
- 17214 N 130th Dr
- 17407 N 130th Ave Unit 9