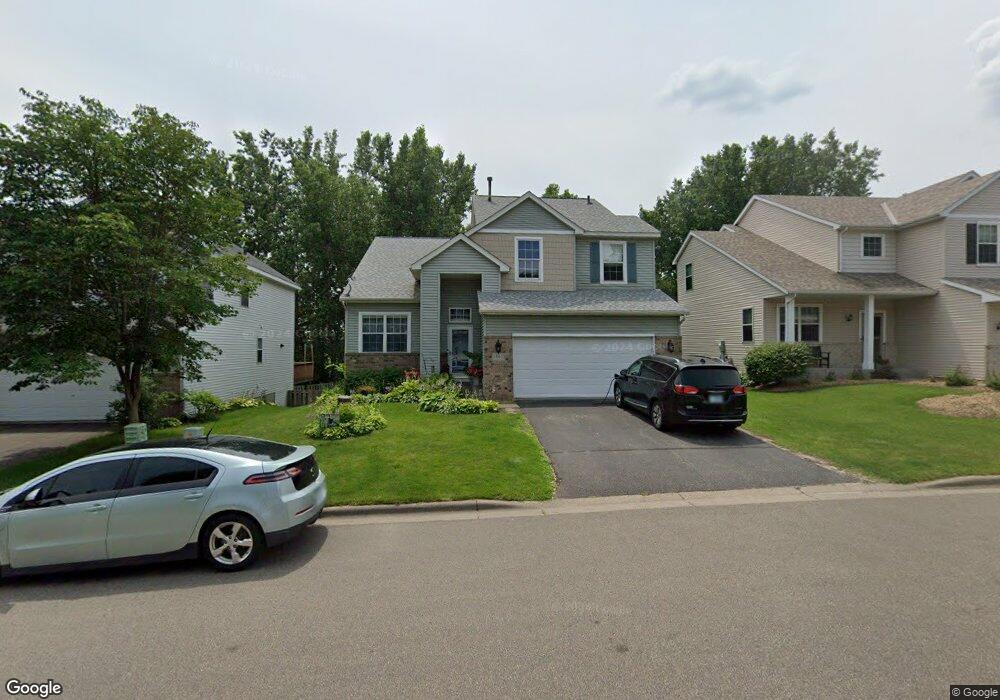
1742 Elm St Saint Paul, MN 55110
Estimated Value: $506,000 - $562,000
4
Beds
3
Baths
2,082
Sq Ft
$251/Sq Ft
Est. Value
About This Home
This home is located at 1742 Elm St, Saint Paul, MN 55110 and is currently estimated at $522,936, approximately $251 per square foot. 1742 Elm St is a home located in Ramsey County with nearby schools including Willow Lane Elementary School, Sunrise Park Middle School, and Gentry Academy High.
Ownership History
Date
Name
Owned For
Owner Type
Purchase Details
Closed on
Mar 17, 2022
Sold by
Johnson Courtney K and Johnson Noah C
Bought by
Ross Kevin J and Ross Emily A
Current Estimated Value
Home Financials for this Owner
Home Financials are based on the most recent Mortgage that was taken out on this home.
Original Mortgage
$382,400
Outstanding Balance
$332,711
Interest Rate
3.39%
Mortgage Type
VA
Estimated Equity
$190,225
Purchase Details
Closed on
Sep 30, 2016
Sold by
Tucker Jon M and Tucker Joy M
Bought by
Johnson Courtney K and Johnson Noah C
Home Financials for this Owner
Home Financials are based on the most recent Mortgage that was taken out on this home.
Original Mortgage
$284,905
Interest Rate
3.46%
Purchase Details
Closed on
Dec 17, 1999
Sold by
Centex Homes Minnesota Division
Bought by
Tucker Jon M and Tucker Joy M
Create a Home Valuation Report for This Property
The Home Valuation Report is an in-depth analysis detailing your home's value as well as a comparison with similar homes in the area
Home Values in the Area
Average Home Value in this Area
Purchase History
| Date | Buyer | Sale Price | Title Company |
|---|---|---|---|
| Ross Kevin J | $478,000 | None Listed On Document | |
| Johnson Courtney K | $308,988 | Titlesmart Inc | |
| Tucker Jon M | $201,845 | -- |
Source: Public Records
Mortgage History
| Date | Status | Borrower | Loan Amount |
|---|---|---|---|
| Open | Ross Kevin J | $382,400 | |
| Previous Owner | Johnson Courtney K | $284,905 |
Source: Public Records
Tax History Compared to Growth
Tax History
| Year | Tax Paid | Tax Assessment Tax Assessment Total Assessment is a certain percentage of the fair market value that is determined by local assessors to be the total taxable value of land and additions on the property. | Land | Improvement |
|---|---|---|---|---|
| 2025 | $6,226 | $485,000 | $63,000 | $422,000 |
| 2024 | $6,226 | $535,100 | $63,000 | $472,100 |
| 2023 | $6,226 | $467,600 | $63,000 | $404,600 |
| 2022 | $4,168 | $378,900 | $63,000 | $315,900 |
| 2021 | $4,270 | $315,400 | $63,000 | $252,400 |
| 2020 | $3,876 | $329,600 | $59,800 | $269,800 |
| 2019 | $3,524 | $283,500 | $59,800 | $223,700 |
| 2018 | $3,392 | $276,700 | $59,800 | $216,900 |
| 2017 | $3,360 | $273,200 | $59,800 | $213,400 |
| 2016 | $3,680 | $0 | $0 | $0 |
| 2015 | $3,486 | $274,300 | $56,200 | $218,100 |
| 2014 | $3,328 | $0 | $0 | $0 |
Source: Public Records
Map
Nearby Homes
- 1776 Elm St
- 3561 Rooney Place
- 3571 Rooney Place
- 3580 Rooney Place
- 3644 Linden Ave Unit 11
- 1827 County Road E E Unit 18
- 1778 Linden Cove
- 3620 Highland Ave
- 3823 Linden Ave
- 1792 Cheri Ct
- 1794 Cheri Ct
- 1795 Cheri Ct
- 3237 Jerry Ct
- 1613 County Road D E Unit L
- 1836 Belland Ave
- 2121 E County Road D
- 1617 Legacy Pkwy E Unit 4
- 1615 Legacy Pkwy E Unit 1011
- 3029 Hemingway Trail N Unit 2
- 2086 Dorothy Ave
- 1740 Elm St
- 1744 Elm St
- 1738 Elm St
- 1746 Elm St
- 1755 Elm St
- 1748 Elm St
- 1751 Elm St Unit 403
- 1753 Elm St Unit 404
- 1749 Elm St
- 1747 1747 Elm St
- 3496 Savannah Ave
- 1759 1759 Elm St
- 3494 Savannah Ave
- 1763 1763 Elm St
- 1765 1765 Elm St
- 1750 Elm St
- 1763 Elm St
- 1761 Elm St Unit 303
- 1759 Elm St Unit 302
- 1757 1757 Elm St