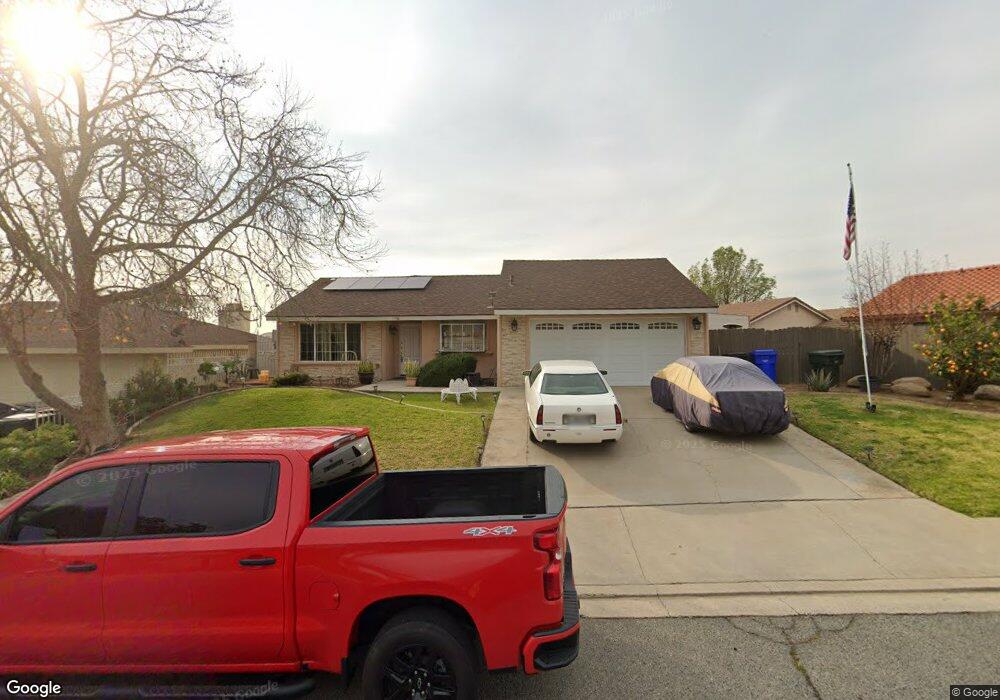
1748 Seine Ave Highland, CA 92346
Crossroads NeighborhoodEstimated Value: $532,636 - $583,000
4
Beds
2
Baths
1,673
Sq Ft
$332/Sq Ft
Est. Value
About This Home
This home is located at 1748 Seine Ave, Highland, CA 92346 and is currently estimated at $556,159, approximately $332 per square foot. 1748 Seine Ave is a home located in San Bernardino County with nearby schools including Thompson Elementary School, Serrano Middle School, and San Gorgonio High School.
Ownership History
Date
Name
Owned For
Owner Type
Purchase Details
Closed on
Apr 2, 2021
Sold by
Zarco Jose Luis and Zarco Rosa Maria
Bought by
Zarco Jose Luis and Zarco Rosa Maria
Current Estimated Value
Purchase Details
Closed on
Feb 11, 1998
Sold by
Hud
Bought by
Zarco Luis A and Zarco Rosa Maria
Home Financials for this Owner
Home Financials are based on the most recent Mortgage that was taken out on this home.
Original Mortgage
$101,662
Outstanding Balance
$18,029
Interest Rate
7.02%
Mortgage Type
FHA
Estimated Equity
$538,130
Purchase Details
Closed on
Oct 14, 1997
Sold by
Chemical Mtg Company
Bought by
Hud
Purchase Details
Closed on
Jul 28, 1997
Sold by
Merendino Robert and Merendino Sandy R
Bought by
Chemical Mtg Company
Purchase Details
Closed on
Jul 3, 1995
Sold by
Merendino Robert
Bought by
Merendino Sandy R
Create a Home Valuation Report for This Property
The Home Valuation Report is an in-depth analysis detailing your home's value as well as a comparison with similar homes in the area
Home Values in the Area
Average Home Value in this Area
Purchase History
| Date | Buyer | Sale Price | Title Company |
|---|---|---|---|
| Zarco Jose Luis | -- | None Available | |
| Zarco Luis A | $102,500 | Commonwealth Land Title Co | |
| Hud | -- | Fidelity National Title Ins | |
| Chemical Mtg Company | $166,091 | Fidelity National Title Ins | |
| Merendino Sandy R | -- | -- |
Source: Public Records
Mortgage History
| Date | Status | Borrower | Loan Amount |
|---|---|---|---|
| Open | Zarco Luis A | $101,662 |
Source: Public Records
Tax History Compared to Growth
Tax History
| Year | Tax Paid | Tax Assessment Tax Assessment Total Assessment is a certain percentage of the fair market value that is determined by local assessors to be the total taxable value of land and additions on the property. | Land | Improvement |
|---|---|---|---|---|
| 2025 | $2,050 | $160,691 | $43,895 | $116,796 |
| 2024 | $2,050 | $157,540 | $43,034 | $114,506 |
| 2023 | $1,997 | $154,451 | $42,190 | $112,261 |
| 2022 | $1,996 | $151,423 | $41,363 | $110,060 |
| 2021 | $1,996 | $148,454 | $40,552 | $107,902 |
| 2020 | $1,997 | $146,932 | $40,136 | $106,796 |
| 2019 | $1,939 | $144,051 | $39,349 | $104,702 |
| 2018 | $1,916 | $141,226 | $38,577 | $102,649 |
| 2017 | $1,855 | $138,457 | $37,821 | $100,636 |
| 2016 | $1,798 | $135,742 | $37,079 | $98,663 |
| 2015 | $1,679 | $133,703 | $36,522 | $97,181 |
| 2014 | $1,631 | $131,084 | $35,807 | $95,277 |
Source: Public Records
Map
Nearby Homes
- 6941 La Praix St
- 27875 Rainbow Ln
- 27953 Atlantic Ave
- 27600 Atlantic Ave Unit 427
- 27888 Rainbow Ln
- 7001 Church Ave Unit 5
- 6986 Church Ave
- 27471 Main St
- 0 La Praix St
- 28037 Clifton St
- 3850 Atlantic Ave Unit 58
- 3850 Atlantic Ave Unit 217
- 3850 Atlantic Ave Unit 275
- 3850 Atlantic Ave Unit 296
- 3850 Atlantic Ave Unit 257
- 3850 Atlantic Ave Unit 27
- 3850 Atlantic Ave Unit 274
- 3850 Atlantic Ave Unit 60
- 3850 Atlantic Ave Unit 151
- 3850 Atlantic Ave Unit 80
- 1734 Seine Ave
- 1785 Buckeye St
- 1795 Buckeye St
- 1718 Seine Ave
- 1775 Buckeye St
- 1749 Seine Ave
- 1765 Seine Ave
- 1735 Seine Ave
- 1704 Seine Ave
- 1779 Seine Ave
- 1765 Buckeye St
- 1695 La Praix St
- 1719 Seine Ave
- 1786 Buckeye St
- 1778 Buckeye St
- 1679 La Praix St
- 1694 Seine Ave
- 1705 Seine Ave
- 1805 Buckeye St
- 1794 Buckeye St