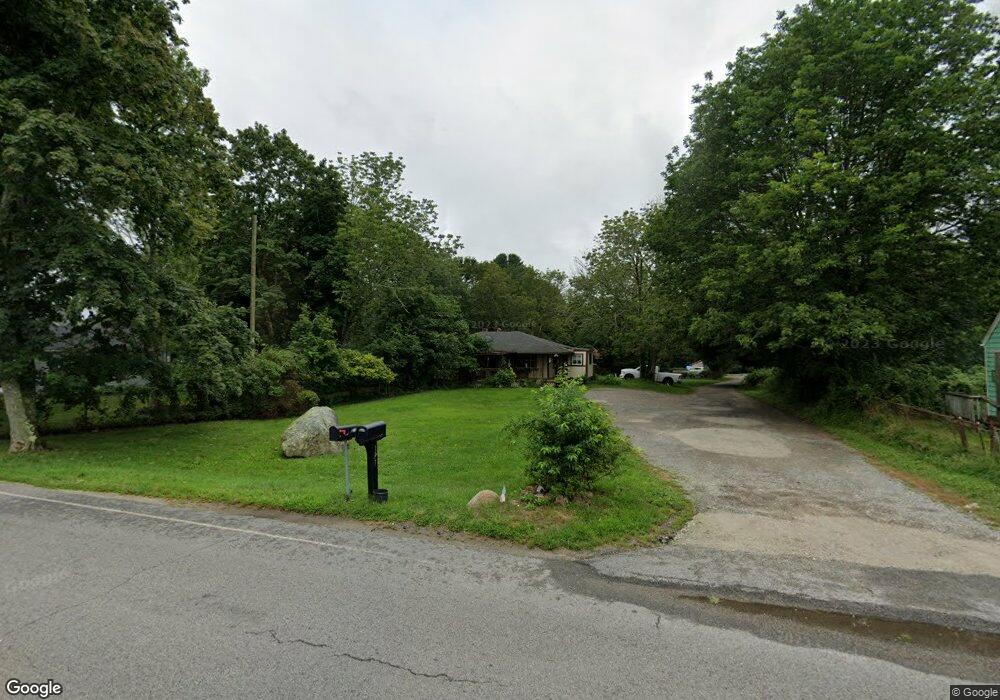
175 Gifford Rd Westport, MA 02790
North Westport NeighborhoodEstimated Value: $398,000 - $511,000
3
Beds
--
Bath
1,087
Sq Ft
$414/Sq Ft
Est. Value
About This Home
This home is located at 175 Gifford Rd, Westport, MA 02790 and is currently estimated at $450,138, approximately $414 per square foot. 175 Gifford Rd is a home located in Bristol County with nearby schools including Alice A. Macomber Primary School, Westport Elementary School, and Westport Middle-High School.
Ownership History
Date
Name
Owned For
Owner Type
Purchase Details
Closed on
Jun 1, 2007
Sold by
Deutsche Bank Natl T C
Bought by
Bennivedse Mark and Bennivedse Mindi
Current Estimated Value
Purchase Details
Closed on
Jul 5, 2006
Sold by
Wright Paul E and Deutsche Bank Natl T C
Bought by
Deutsche Bank Natl T C
Create a Home Valuation Report for This Property
The Home Valuation Report is an in-depth analysis detailing your home's value as well as a comparison with similar homes in the area
Home Values in the Area
Average Home Value in this Area
Purchase History
| Date | Buyer | Sale Price | Title Company |
|---|---|---|---|
| Bennivedse Mark | $159,000 | -- | |
| Deutsche Bank Natl T C | $246,022 | -- |
Source: Public Records
Mortgage History
| Date | Status | Borrower | Loan Amount |
|---|---|---|---|
| Open | Deutsche Bank Natl T C | $222,933 | |
| Closed | Deutsche Bank Natl T C | $220,390 |
Source: Public Records
Tax History Compared to Growth
Tax History
| Year | Tax Paid | Tax Assessment Tax Assessment Total Assessment is a certain percentage of the fair market value that is determined by local assessors to be the total taxable value of land and additions on the property. | Land | Improvement |
|---|---|---|---|---|
| 2025 | $2,508 | $336,700 | $168,700 | $168,000 |
| 2024 | $2,439 | $315,500 | $149,800 | $165,700 |
| 2023 | $2,306 | $282,600 | $136,500 | $146,100 |
| 2022 | $2,210 | $260,600 | $136,500 | $124,100 |
| 2021 | $2,042 | $236,900 | $112,800 | $124,100 |
| 2020 | $1,959 | $232,400 | $108,300 | $124,100 |
| 2019 | $1,873 | $226,500 | $108,300 | $118,200 |
| 2018 | $1,624 | $198,800 | $109,500 | $89,300 |
| 2017 | $1,542 | $193,500 | $106,000 | $87,500 |
| 2016 | $1,466 | $185,300 | $102,500 | $82,800 |
| 2015 | $1,417 | $178,700 | $104,900 | $73,800 |
Source: Public Records
Map
Nearby Homes