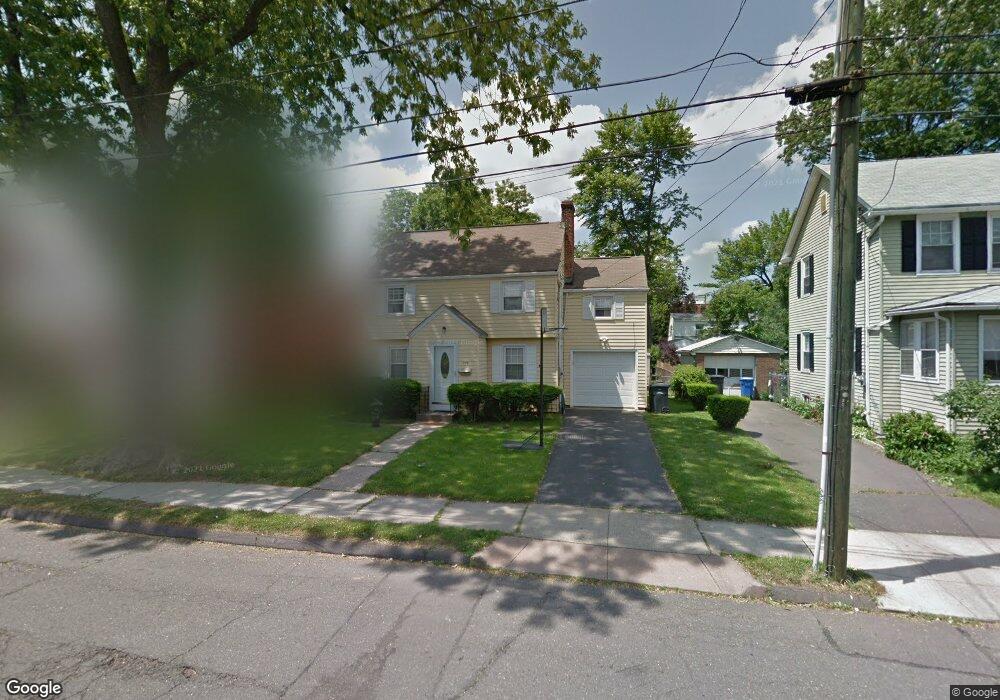
176 Gilman St Hartford, CT 06114
South End NeighborhoodEstimated Value: $270,000 - $311,000
3
Beds
3
Baths
1,373
Sq Ft
$214/Sq Ft
Est. Value
About This Home
This home is located at 176 Gilman St, Hartford, CT 06114 and is currently estimated at $294,023, approximately $214 per square foot. 176 Gilman St is a home located in Hartford County with nearby schools including Asian Studies School At Dwight/Belizzi School, M. D. Fox School, and Dr. James H Naylor/Ccsu Leadership Academy.
Ownership History
Date
Name
Owned For
Owner Type
Purchase Details
Closed on
Apr 27, 2005
Sold by
Brunetti Camella
Bought by
Zapata Rafael
Current Estimated Value
Home Financials for this Owner
Home Financials are based on the most recent Mortgage that was taken out on this home.
Original Mortgage
$141,600
Interest Rate
6.62%
Mortgage Type
Purchase Money Mortgage
Create a Home Valuation Report for This Property
The Home Valuation Report is an in-depth analysis detailing your home's value as well as a comparison with similar homes in the area
Home Values in the Area
Average Home Value in this Area
Purchase History
| Date | Buyer | Sale Price | Title Company |
|---|---|---|---|
| Zapata Rafael | $177,000 | -- |
Source: Public Records
Mortgage History
| Date | Status | Borrower | Loan Amount |
|---|---|---|---|
| Open | Zapata Rafael | $172,000 | |
| Closed | Zapata Rafael | $32,200 | |
| Closed | Zapata Rafael | $50,500 | |
| Closed | Zapata Rafael | $141,600 |
Source: Public Records
Tax History Compared to Growth
Tax History
| Year | Tax Paid | Tax Assessment Tax Assessment Total Assessment is a certain percentage of the fair market value that is determined by local assessors to be the total taxable value of land and additions on the property. | Land | Improvement |
|---|---|---|---|---|
| 2025 | $4,439 | $64,386 | $10,253 | $54,133 |
| 2024 | $4,439 | $64,386 | $10,253 | $54,133 |
| 2023 | $4,439 | $64,386 | $10,253 | $54,133 |
| 2022 | $4,439 | $64,386 | $10,253 | $54,133 |
| 2021 | $3,365 | $45,290 | $13,475 | $31,815 |
| 2020 | $3,216 | $43,295 | $13,475 | $29,820 |
| 2019 | $3,216 | $43,295 | $13,475 | $29,820 |
| 2018 | $3,108 | $41,835 | $13,020 | $28,815 |
| 2016 | $2,943 | $39,618 | $12,401 | $27,217 |
| 2015 | $2,803 | $37,736 | $11,811 | $25,925 |
| 2014 | $2,735 | $36,814 | $11,523 | $25,291 |
Source: Public Records
Map
Nearby Homes
- 308 Brown St
- 159 Gilman St
- 405 W Preston St Unit 407
- 35 Clifford St
- 218 Grandview Terrace Unit 220
- 147 Newbury St Unit 149
- 152 Otis St
- 183 Preston St Unit 185
- 90 Harwich St Unit 92
- 185 Grandview Terrace Unit 187
- 147 Preston St Unit 1
- 46 Harwich St
- 73 Mountford St Unit 3B
- 69 Mountford St Unit 3A
- 49 Newbury St Unit 51
- 390 Fairfield Ave
- 61 Preston St Unit 63
- 474 Hillside Ave
- 90 Salem St
- 71 Hanmer St