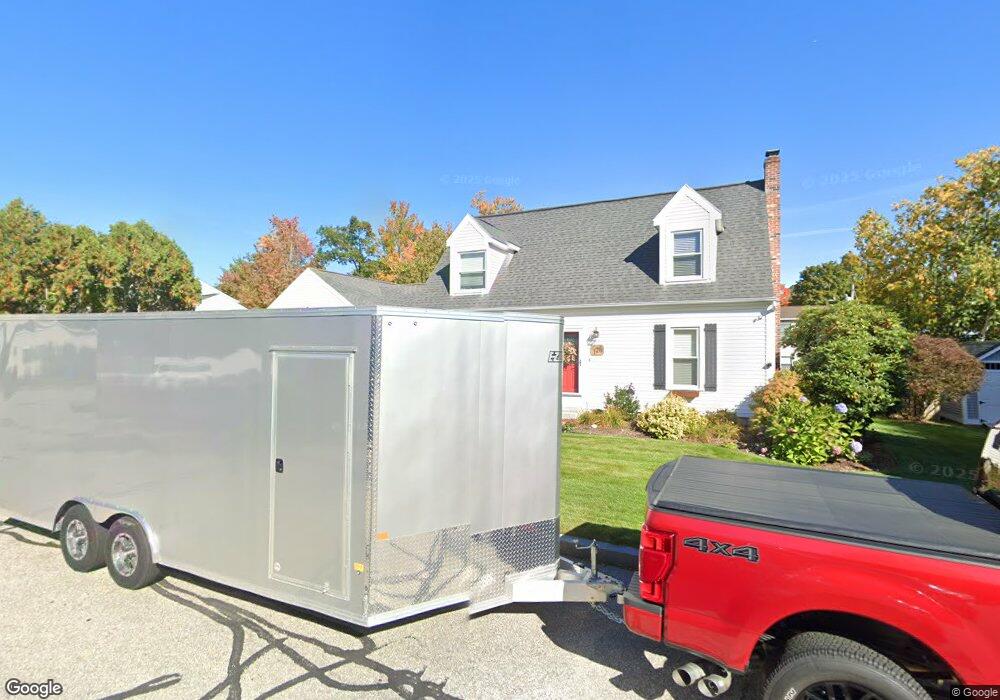
176 Stanton St Manchester, NH 03103
Southside NeighborhoodEstimated Value: $554,000 - $591,000
3
Beds
3
Baths
2,376
Sq Ft
$239/Sq Ft
Est. Value
About This Home
This home is located at 176 Stanton St, Manchester, NH 03103 and is currently estimated at $567,963, approximately $239 per square foot. 176 Stanton St is a home located in Hillsborough County with nearby schools including Jewett Street Elementary School, Southside Middle School, and Manchester Memorial High School.
Ownership History
Date
Name
Owned For
Owner Type
Purchase Details
Closed on
Jan 31, 2012
Sold by
Hemeon James F and Hemeon Rose E
Bought by
Dardas Susan E
Current Estimated Value
Purchase Details
Closed on
Jun 24, 2005
Sold by
Tran Nguyen Quoc
Bought by
Hemeon James F and Hemeon Rose E
Purchase Details
Closed on
Jun 15, 1999
Sold by
Bo Hwa Shin and Bo Chiu Lien
Bought by
Ho Den Ching and Ho Fanny Chi-Sum
Create a Home Valuation Report for This Property
The Home Valuation Report is an in-depth analysis detailing your home's value as well as a comparison with similar homes in the area
Home Values in the Area
Average Home Value in this Area
Purchase History
| Date | Buyer | Sale Price | Title Company |
|---|---|---|---|
| Dardas Susan E | $220,000 | -- | |
| Dardas Susan E | $220,000 | -- | |
| Hemeon James F | $285,000 | -- | |
| Hemeon James F | $285,000 | -- | |
| Ho Den Ching | $130,000 | -- | |
| Ho Den Ching | $130,000 | -- |
Source: Public Records
Mortgage History
| Date | Status | Borrower | Loan Amount |
|---|---|---|---|
| Previous Owner | Ho Den Ching | $25,000 | |
| Previous Owner | Ho Den Ching | $25,000 |
Source: Public Records
Tax History Compared to Growth
Tax History
| Year | Tax Paid | Tax Assessment Tax Assessment Total Assessment is a certain percentage of the fair market value that is determined by local assessors to be the total taxable value of land and additions on the property. | Land | Improvement |
|---|---|---|---|---|
| 2024 | $7,517 | $383,900 | $103,400 | $280,500 |
| 2023 | $7,240 | $383,900 | $103,400 | $280,500 |
| 2022 | $7,002 | $383,900 | $103,400 | $280,500 |
| 2021 | $6,787 | $383,900 | $103,400 | $280,500 |
| 2020 | $6,616 | $268,300 | $71,300 | $197,000 |
| 2019 | $6,525 | $268,300 | $71,300 | $197,000 |
| 2018 | $6,353 | $268,300 | $71,300 | $197,000 |
| 2017 | $6,257 | $268,300 | $71,300 | $197,000 |
| 2016 | $6,208 | $268,300 | $71,300 | $197,000 |
| 2015 | $5,794 | $247,200 | $66,000 | $181,200 |
| 2014 | $5,809 | $247,200 | $66,000 | $181,200 |
| 2013 | $5,531 | $244,000 | $66,000 | $178,000 |
Source: Public Records
Map
Nearby Homes