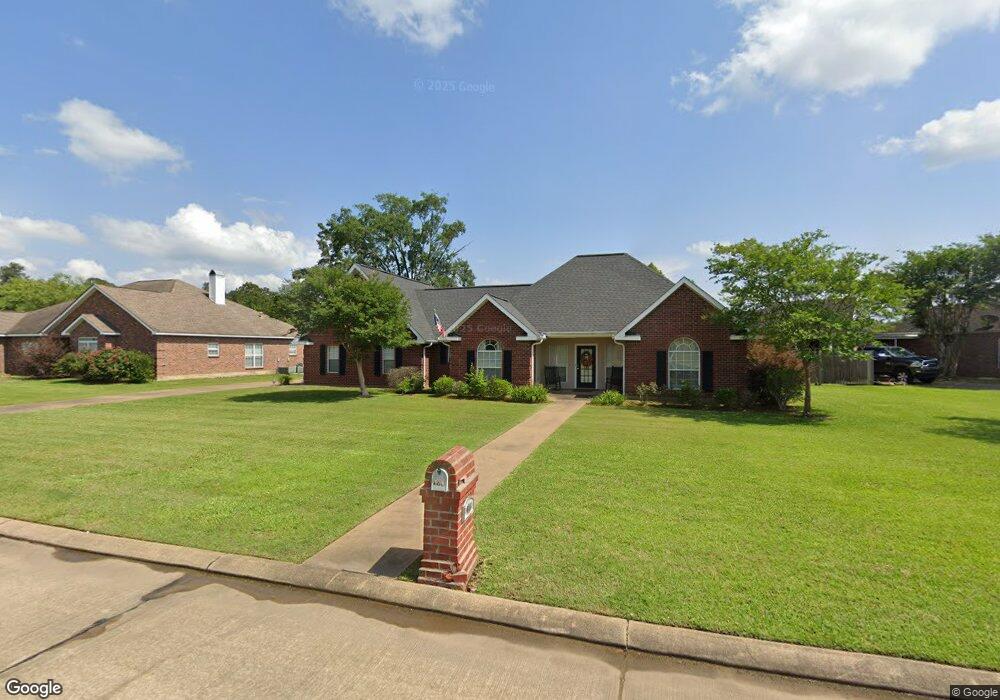
176 Sweetwater Rim Pineville, LA 71360
Estimated Value: $278,000 - $347,471
4
Beds
3
Baths
2,250
Sq Ft
$141/Sq Ft
Est. Value
About This Home
This home is located at 176 Sweetwater Rim, Pineville, LA 71360 and is currently estimated at $317,118, approximately $140 per square foot. 176 Sweetwater Rim is a home located in Rapides Parish with nearby schools including J.I. Barron Sr. Elementary School, Pineville Junior High School, and Pineville High School.
Ownership History
Date
Name
Owned For
Owner Type
Purchase Details
Closed on
Feb 19, 2010
Sold by
Fannie Mae
Bought by
Armstrong Ralston Evelyn Darise and Ralston James George
Current Estimated Value
Purchase Details
Closed on
Dec 11, 2009
Sold by
Chase Home Finance Llc
Bought by
Federal National Mortgage Association
Purchase Details
Closed on
Jul 25, 2008
Sold by
Elliott Kirk Clara Mae and Ray Kirk Howard
Bought by
Chase Home Finance Llc
Purchase Details
Closed on
Oct 28, 2005
Sold by
Whatley Michele Denise and Whatley James Danny
Bought by
Ray Kirk Howard and Elliott Kirk Clara Mae
Home Financials for this Owner
Home Financials are based on the most recent Mortgage that was taken out on this home.
Original Mortgage
$183,900
Interest Rate
5.47%
Mortgage Type
New Conventional
Create a Home Valuation Report for This Property
The Home Valuation Report is an in-depth analysis detailing your home's value as well as a comparison with similar homes in the area
Home Values in the Area
Average Home Value in this Area
Purchase History
| Date | Buyer | Sale Price | Title Company |
|---|---|---|---|
| Armstrong Ralston Evelyn Darise | $228,505 | None Available | |
| Federal National Mortgage Association | $167,046 | None Available | |
| Chase Home Finance Llc | $167,000 | None Available | |
| Ray Kirk Howard | $229,900 | None Available |
Source: Public Records
Mortgage History
| Date | Status | Borrower | Loan Amount |
|---|---|---|---|
| Previous Owner | Ray Kirk Howard | $183,900 |
Source: Public Records
Tax History Compared to Growth
Tax History
| Year | Tax Paid | Tax Assessment Tax Assessment Total Assessment is a certain percentage of the fair market value that is determined by local assessors to be the total taxable value of land and additions on the property. | Land | Improvement |
|---|---|---|---|---|
| 2024 | $3,628 | $27,400 | $5,500 | $21,900 |
| 2023 | $3,654 | $26,100 | $5,200 | $20,900 |
| 2022 | $3,817 | $26,100 | $5,200 | $20,900 |
| 2021 | $3,856 | $26,100 | $5,200 | $20,900 |
| 2020 | $3,878 | $26,100 | $5,200 | $20,900 |
| 2019 | $3,206 | $24,400 | $4,900 | $19,500 |
| 2018 | $3,183 | $24,400 | $4,900 | $19,500 |
| 2017 | $3,122 | $24,400 | $4,900 | $19,500 |
| 2016 | $3,509 | $24,400 | $4,900 | $19,500 |
| 2015 | $3,322 | $22,851 | $4,598 | $18,253 |
| 2014 | $3,311 | $22,851 | $4,598 | $18,253 |
| 2013 | $3,235 | $22,851 | $4,598 | $18,253 |
Source: Public Records
Map
Nearby Homes
- 157 Lakeland Dr
- TBD Susek Dr
- 116 Walker Dr
- 215 Holly Moore Dr
- 526 Holly Moore Dr
- 1497 Susek Dr
- 152 Huntington Dr None
- 124 Huntington Dr
- 106 Louise Dr
- 329 Saint Landry Dr
- 567 Edgewood Dr
- 0 Wildwood Dr
- 1038 Susek Dr
- 110 Iris Cir
- 203 Iris Park Dr
- 303 Raintree Place
- 1620 Susek Dr
- 1628 Susek Dr
- 0 Crossover Rd
- 2917 Neal Dr
- 168 Sweetwater Rim
- 184 Sweetwater Rim
- 188 Sweetwater Rim
- 160 Sweetwater Rim
- 134 Lakeland Dr
- 142 Lakeland Dr
- 156 Sweetwater Rim
- 192 Sweetwater Rim
- 146 Lakeland Dr
- 179 Sweetwater Rim
- 130 Lakeland Dr
- 138 Lakeland Dr
- 150 Lakeland Dr
- 0 Lakeland Dr
- 175 Sweetwater Rim
- 152 Sweetwater Rim
- 183 Sweetwater Rim
- 154 Lakeland Dr
- 0 Sweetwater Rim
- 171 Sweetwater Rim