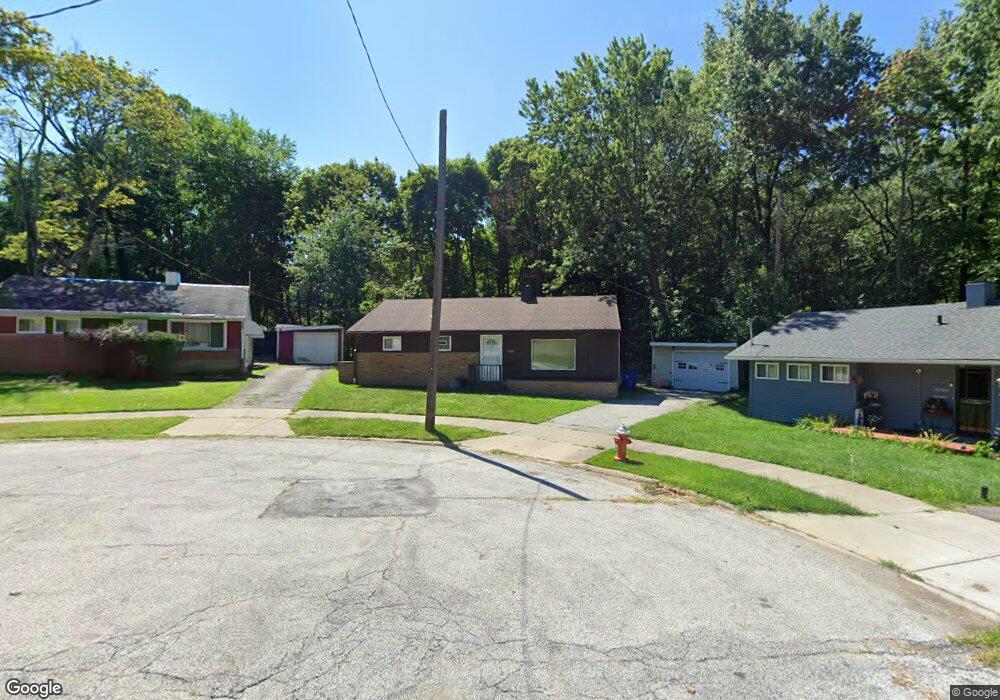
17606 Rook Cir Cleveland, OH 44112
Euclid-Green NeighborhoodEstimated Value: $77,000 - $109,000
3
Beds
1
Bath
1,080
Sq Ft
$87/Sq Ft
Est. Value
About This Home
This home is located at 17606 Rook Cir, Cleveland, OH 44112 and is currently estimated at $93,826, approximately $86 per square foot. 17606 Rook Cir is a home located in Cuyahoga County with nearby schools including Bolton, Anton Grdina School, and Andrew J. Rickoff School.
Ownership History
Date
Name
Owned For
Owner Type
Purchase Details
Closed on
May 3, 2018
Sold by
Reichelt Marie
Bought by
Liang Gang and Pea And Potato 401K Trust
Current Estimated Value
Purchase Details
Closed on
Mar 10, 2016
Sold by
Natures Beauty Tree Service Llc
Bought by
Nb Cleveland Llc
Purchase Details
Closed on
Mar 6, 2014
Sold by
Harrison Seth
Bought by
Natures Beauty Tree Service Llc
Purchase Details
Closed on
Jun 20, 2012
Sold by
Nationwide Construction & Development Ll
Bought by
Harrison Seth
Purchase Details
Closed on
Dec 5, 2008
Sold by
Citimortgage Inc
Bought by
Nationwide Construction & Development Ll
Purchase Details
Closed on
May 15, 2008
Sold by
Williams Briddock
Bought by
Citimortgage Inc
Purchase Details
Closed on
Jun 18, 1982
Sold by
Williams Briddock
Bought by
Briddock Williams
Purchase Details
Closed on
Dec 12, 1978
Sold by
Kieselbach Alfred G and Kieselbach M
Bought by
Williams Briddock
Purchase Details
Closed on
Jan 1, 1975
Bought by
Kieselbach Alfred G and Kieselbach M
Create a Home Valuation Report for This Property
The Home Valuation Report is an in-depth analysis detailing your home's value as well as a comparison with similar homes in the area
Home Values in the Area
Average Home Value in this Area
Purchase History
| Date | Buyer | Sale Price | Title Company |
|---|---|---|---|
| Liang Gang | $30,000 | Accommodation | |
| Nb Cleveland Llc | -- | Public | |
| Natures Beauty Tree Service Llc | -- | None Available | |
| Harrison Seth | $5,000 | None Available | |
| Nationwide Construction & Development Ll | $5,000 | Attorney | |
| Citimortgage Inc | $47,000 | Attorney | |
| Briddock Williams | -- | -- | |
| Williams Briddock | $37,500 | -- | |
| Kieselbach Alfred G | -- | -- |
Source: Public Records
Tax History Compared to Growth
Tax History
| Year | Tax Paid | Tax Assessment Tax Assessment Total Assessment is a certain percentage of the fair market value that is determined by local assessors to be the total taxable value of land and additions on the property. | Land | Improvement |
|---|---|---|---|---|
| 2024 | $1,660 | $24,815 | $3,220 | $21,595 |
| 2023 | $1,036 | $13,370 | $2,030 | $11,340 |
| 2022 | $1,031 | $13,370 | $2,030 | $11,340 |
| 2021 | $1,021 | $13,370 | $2,030 | $11,340 |
| 2020 | $983 | $11,130 | $1,680 | $9,450 |
| 2019 | $911 | $31,800 | $4,800 | $27,000 |
| 2018 | $1,056 | $11,130 | $1,680 | $9,450 |
| 2017 | $1,217 | $14,390 | $3,260 | $11,130 |
| 2016 | $1,207 | $14,390 | $3,260 | $11,130 |
| 2015 | $1,207 | $14,390 | $3,260 | $11,130 |
| 2014 | $1,219 | $14,840 | $3,360 | $11,480 |
Source: Public Records
Map
Nearby Homes
- 1897 Torbenson Dr
- 1767 Algonac Rd Unit 2
- 1758 Algonac Rd
- 1738 Burgess Rd
- 2116 Reyburn Rd
- 1738 Cliffview Rd
- 2133 Reyburn Rd
- 1875 Lampson Rd
- 3595 Runnymede Blvd
- 2121 Alton Rd
- 16624 Endora Rd
- 1677 Hillview Rd
- 18001 Olympia Rd
- 1816 Lampson Rd
- 1682 Cliffview Rd
- 18132 Weston Rd
- 1646 Avalon Rd
- 940 London Rd
- 949 Rudyard Rd
- 1639 Avalon Rd
- 17610 Rook Cir
- 17602 Rook Cir
- 17614 Rook Cir
- 1938 Rookwood Rd
- 17601 Rook Cir
- 1942 Rookwood Rd
- 17609 Rook Cir
- 17605 Rook Cir
- 1924 Rookwood Rd
- 1944 Rookwood Rd
- 1920 Rookwood Rd
- 1935 Rookwood Rd
- 1929 Rookwood Rd
- 1925 Rookwood Rd
- 1948 Rookwood Rd
- 1918 Rookwood Rd
- 1921 Rookwood Rd
- 17700 Rookhill Cir
- 1952 Rookwood Rd
- 1915 Rookwood Rd