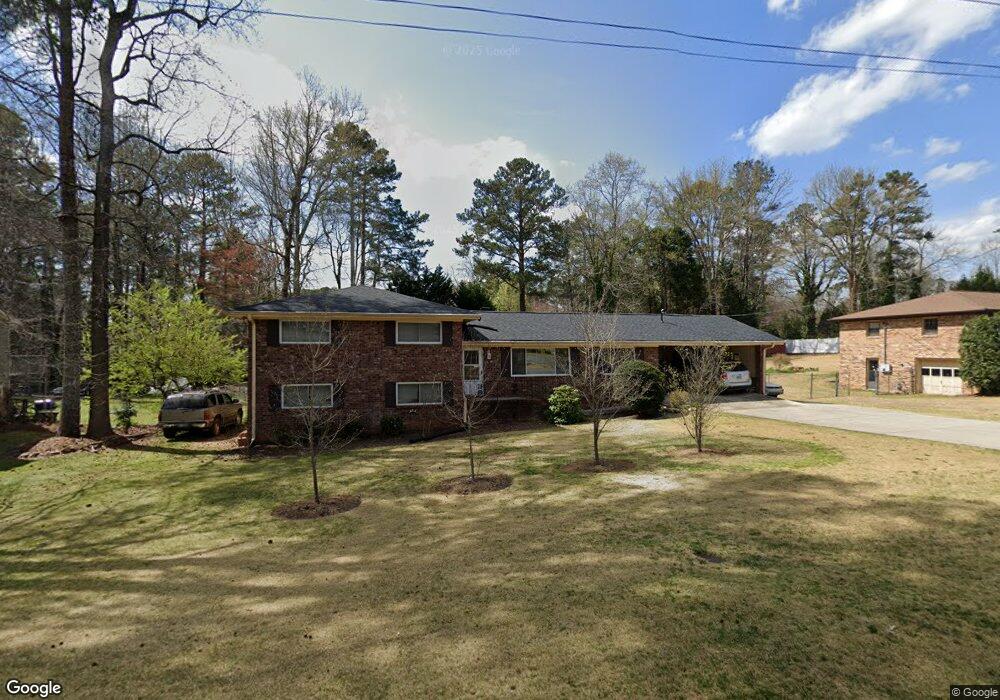
1761 Rugby Rd Marietta, GA 30062
Eastern Marietta NeighborhoodEstimated Value: $347,844 - $441,000
3
Beds
2
Baths
1,472
Sq Ft
$268/Sq Ft
Est. Value
About This Home
This home is located at 1761 Rugby Rd, Marietta, GA 30062 and is currently estimated at $394,461, approximately $267 per square foot. 1761 Rugby Rd is a home located in Cobb County with nearby schools including Kincaid Elementary School, Simpson Middle School, and Sprayberry High School.
Ownership History
Date
Name
Owned For
Owner Type
Purchase Details
Closed on
May 27, 2004
Sold by
Held Marcus and Held Angela
Bought by
Saldivar Jorge
Current Estimated Value
Home Financials for this Owner
Home Financials are based on the most recent Mortgage that was taken out on this home.
Original Mortgage
$148,850
Outstanding Balance
$72,138
Interest Rate
5.98%
Mortgage Type
New Conventional
Estimated Equity
$322,324
Purchase Details
Closed on
Apr 12, 2003
Sold by
Bullock George J and Bullock Betty A
Bought by
Held Marcus and Held Angela
Home Financials for this Owner
Home Financials are based on the most recent Mortgage that was taken out on this home.
Original Mortgage
$89,000
Interest Rate
5.74%
Purchase Details
Closed on
Oct 25, 1999
Sold by
Fox Larry F
Bought by
Bullock George J and Bullock Betty A
Home Financials for this Owner
Home Financials are based on the most recent Mortgage that was taken out on this home.
Original Mortgage
$94,800
Interest Rate
7.7%
Mortgage Type
New Conventional
Create a Home Valuation Report for This Property
The Home Valuation Report is an in-depth analysis detailing your home's value as well as a comparison with similar homes in the area
Home Values in the Area
Average Home Value in this Area
Purchase History
| Date | Buyer | Sale Price | Title Company |
|---|---|---|---|
| Saldivar Jorge | $149,000 | -- | |
| Held Marcus | $119,000 | -- | |
| Bullock George J | $118,500 | -- |
Source: Public Records
Mortgage History
| Date | Status | Borrower | Loan Amount |
|---|---|---|---|
| Open | Saldivar Jorge | $148,850 | |
| Previous Owner | Held Marcus | $89,000 | |
| Previous Owner | Bullock George J | $94,800 |
Source: Public Records
Tax History Compared to Growth
Tax History
| Year | Tax Paid | Tax Assessment Tax Assessment Total Assessment is a certain percentage of the fair market value that is determined by local assessors to be the total taxable value of land and additions on the property. | Land | Improvement |
|---|---|---|---|---|
| 2025 | $2,980 | $130,792 | $38,000 | $92,792 |
| 2024 | $2,983 | $130,792 | $38,000 | $92,792 |
| 2023 | $2,163 | $118,016 | $32,000 | $86,016 |
| 2022 | $2,404 | $103,236 | $28,000 | $75,236 |
| 2021 | $2,067 | $87,860 | $26,000 | $61,860 |
| 2020 | $2,067 | $87,860 | $26,000 | $61,860 |
| 2019 | $1,626 | $67,704 | $22,000 | $45,704 |
| 2018 | $1,626 | $67,704 | $22,000 | $45,704 |
| 2017 | $1,376 | $59,092 | $18,000 | $41,092 |
| 2016 | $1,378 | $59,092 | $18,000 | $41,092 |
| 2015 | $1,189 | $49,208 | $18,000 | $31,208 |
| 2014 | $1,200 | $49,208 | $0 | $0 |
Source: Public Records
Map
Nearby Homes
- 1751 Rugby Rd
- 1771 Rugby Rd
- 1780 Branch View Dr
- 1790 Branch View Dr
- 1900 Wynn Dr
- 1741 Rugby Rd
- 1781 Rugby Rd
- 1770 Branch View Dr
- 0 Rugby Rd
- 1780 Rugby Rd
- 1782 Rugby Rd
- 1800 Branch View Dr
- 1801 Romans Dr
- 1908 Wynn Dr
- 1731 Rugby Rd
- 1805 Rugby Rd
- 1909 Wynn Dr
- 1810 Branch View Dr
- 1799 San Andra Dr
- 1811 Romans Dr