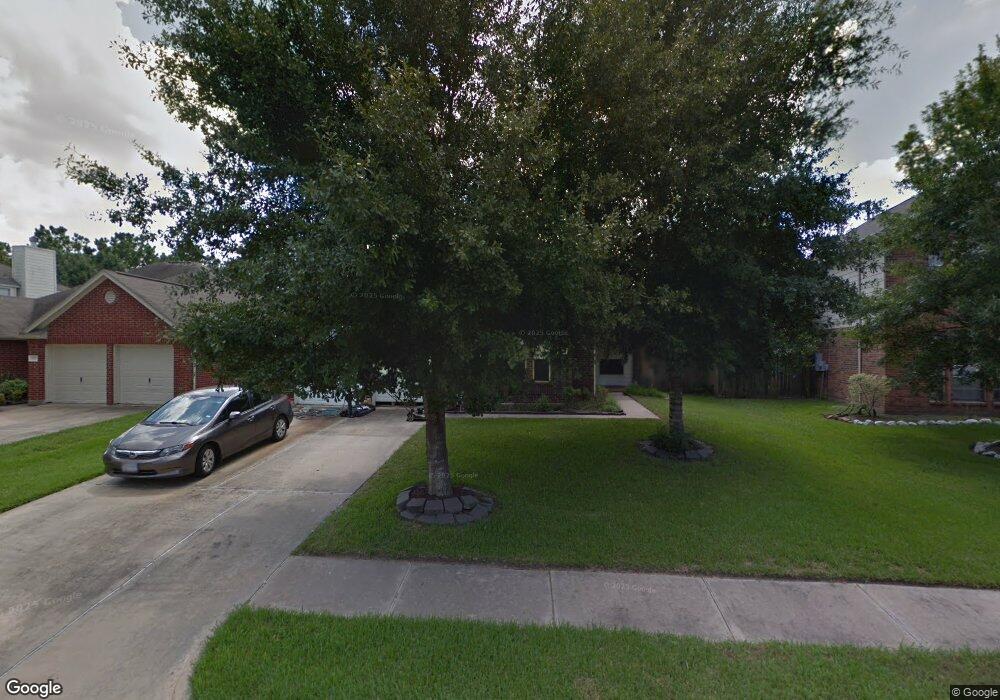
17611 Fairgrove Park Dr Houston, TX 77095
Copper Lakes NeighborhoodEstimated Value: $345,000 - $364,000
3
Beds
3
Baths
2,407
Sq Ft
$147/Sq Ft
Est. Value
About This Home
This home is located at 17611 Fairgrove Park Dr, Houston, TX 77095 and is currently estimated at $353,040, approximately $146 per square foot. 17611 Fairgrove Park Dr is a home located in Harris County with nearby schools including Copeland Elementary School, Aragon Middle School, and Langham Creek High School.
Ownership History
Date
Name
Owned For
Owner Type
Purchase Details
Closed on
Oct 10, 2017
Sold by
Acevedo Marta G and Acevedo Juan Jose
Bought by
Ospina Sebastian and Ospina Katherina Z
Current Estimated Value
Home Financials for this Owner
Home Financials are based on the most recent Mortgage that was taken out on this home.
Original Mortgage
$168,000
Outstanding Balance
$140,327
Interest Rate
3.82%
Mortgage Type
New Conventional
Estimated Equity
$212,713
Purchase Details
Closed on
Feb 22, 2017
Sold by
Moore David B and Moore Pamala G
Bought by
Acevedo Marta G
Purchase Details
Closed on
Jul 23, 1999
Sold by
Royce Homes Lp
Bought by
Moore David B and Moore Pamala G
Home Financials for this Owner
Home Financials are based on the most recent Mortgage that was taken out on this home.
Original Mortgage
$108,650
Interest Rate
7.47%
Mortgage Type
Stand Alone First
Purchase Details
Closed on
Oct 23, 1998
Sold by
Ensign Investments Inc
Bought by
Royce Homes Lp
Create a Home Valuation Report for This Property
The Home Valuation Report is an in-depth analysis detailing your home's value as well as a comparison with similar homes in the area
Home Values in the Area
Average Home Value in this Area
Purchase History
| Date | Buyer | Sale Price | Title Company |
|---|---|---|---|
| Ospina Sebastian | -- | First American Title | |
| Acevedo Marta G | -- | None Available | |
| Moore David B | -- | Stewart Title | |
| Royce Homes Lp | -- | Stewart Title |
Source: Public Records
Mortgage History
| Date | Status | Borrower | Loan Amount |
|---|---|---|---|
| Open | Ospina Sebastian | $168,000 | |
| Previous Owner | Moore David B | $108,650 |
Source: Public Records
Tax History Compared to Growth
Tax History
| Year | Tax Paid | Tax Assessment Tax Assessment Total Assessment is a certain percentage of the fair market value that is determined by local assessors to be the total taxable value of land and additions on the property. | Land | Improvement |
|---|---|---|---|---|
| 2025 | $4,900 | $359,985 | $71,361 | $288,624 |
| 2024 | $4,900 | $328,126 | $59,574 | $268,552 |
| 2023 | $4,900 | $365,599 | $59,574 | $306,025 |
| 2022 | $6,856 | $317,770 | $45,875 | $271,895 |
| 2021 | $6,606 | $258,694 | $45,875 | $212,819 |
| 2020 | $6,375 | $240,617 | $32,813 | $207,804 |
| 2019 | $6,280 | $229,974 | $32,813 | $197,161 |
| 2018 | $2,168 | $219,419 | $32,813 | $186,606 |
| 2017 | $6,092 | $219,419 | $32,813 | $186,606 |
| 2016 | $5,892 | $212,215 | $32,813 | $179,402 |
| 2015 | $3,994 | $196,361 | $32,813 | $163,548 |
| 2014 | $3,994 | $177,057 | $32,813 | $144,244 |
Source: Public Records
Map
Nearby Homes
- 17603 Fairgrove Park Dr
- 17531 Cypress Laurel St
- 8311 Brighton Lake Ln
- 8410 Brighton Lake Ln
- 8507 Forest Arbor Ct
- 17310 Crescent Canyon Dr
- 8519 Sunrise Meadow Ln
- 17518 Rustling Aspen Ln
- 7918 Blue Wahoo Ln
- 17710 Noble Oak Ct
- 18114 Shallow Leaf Ln
- 8803 Emerald Shore Ct
- 7838 Blue Wahoo Ln
- 7951 Barker Cypress Rd
- 17814 Stoney Glade Ct
- 18202 Rexine Ln
- 18202 Foley Park Ct
- 8823 Hollow Banks Ln
- 7807 Hickory Mill Ct
- 8410 Castle Pond Ct
- 17615 Fairgrove Park Dr
- 17607 Fairgrove Park Dr
- 17619 Fairgrove Park Dr
- 17519 Fairgrove Park Dr
- 17614 Fairgrove Park Dr
- 17610 Fairgrove Park Dr
- 17703 Fairgrove Park Dr
- 17606 Fairgrove Park Dr
- 17618 Fairgrove Park Dr
- 17602 Fairgrove Park Dr
- 17515 Fairgrove Park Dr
- 17702 Fairgrove Park Dr
- 8110 Hollowhaven Ct
- 8210 Fairgrove Park Ct
- 8206 Fairgrove Park Ct
- 17706 Fairgrove Park Dr
- 17611 Quiet Dawn Ct
- 17615 Quiet Dawn Ct
- 17511 Fairgrove Park Dr
- 17607 Quiet Dawn Ct