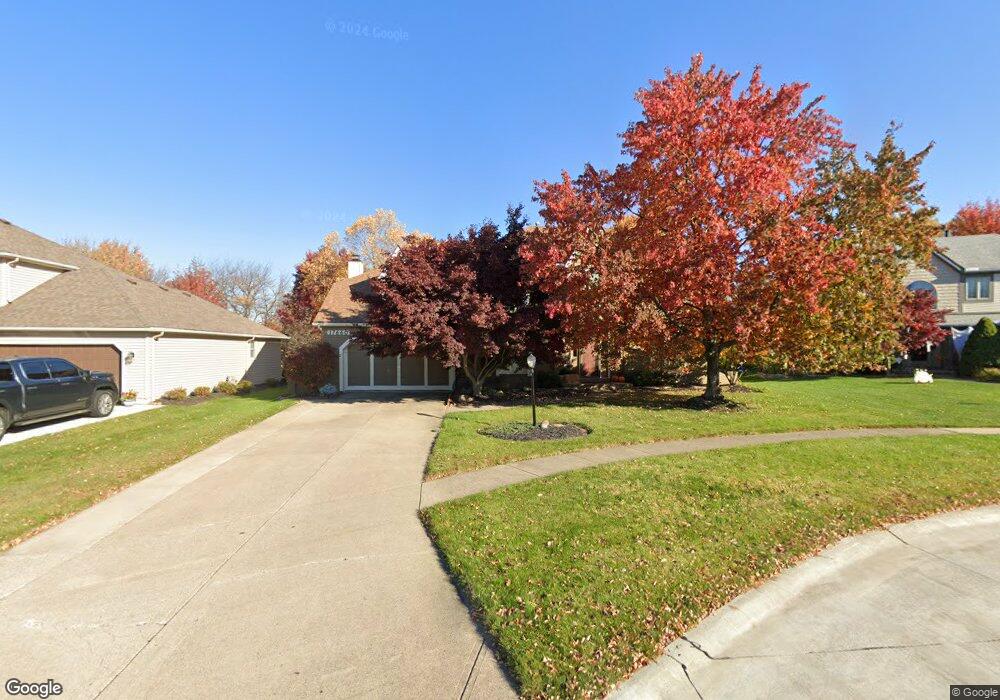
17660 Plymouth Row Strongsville, OH 44136
Estimated Value: $400,000 - $476,000
4
Beds
3
Baths
2,858
Sq Ft
$149/Sq Ft
Est. Value
About This Home
This home is located at 17660 Plymouth Row, Strongsville, OH 44136 and is currently estimated at $425,804, approximately $148 per square foot. 17660 Plymouth Row is a home located in Cuyahoga County with nearby schools including Strongsville High School and Sts Joseph & John Interparochial School.
Ownership History
Date
Name
Owned For
Owner Type
Purchase Details
Closed on
May 2, 2017
Sold by
Sommers Sommers N and Sommers Sherri L
Bought by
Sommers Sommers N and Sommers Sherri L
Current Estimated Value
Home Financials for this Owner
Home Financials are based on the most recent Mortgage that was taken out on this home.
Original Mortgage
$161,000
Outstanding Balance
$134,366
Interest Rate
4.23%
Mortgage Type
New Conventional
Estimated Equity
$291,438
Purchase Details
Closed on
Jul 5, 2011
Sold by
Chima Rodrick V and Chima Cinda S
Bought by
Sommers N Douglas
Home Financials for this Owner
Home Financials are based on the most recent Mortgage that was taken out on this home.
Original Mortgage
$175,200
Interest Rate
4.63%
Mortgage Type
New Conventional
Purchase Details
Closed on
Dec 11, 1986
Bought by
Chima Rodrick
Purchase Details
Closed on
Mar 20, 1986
Bought by
Hickory Hills Homes
Purchase Details
Closed on
Jan 1, 1981
Bought by
Casa Dev Co
Create a Home Valuation Report for This Property
The Home Valuation Report is an in-depth analysis detailing your home's value as well as a comparison with similar homes in the area
Home Values in the Area
Average Home Value in this Area
Purchase History
| Date | Buyer | Sale Price | Title Company |
|---|---|---|---|
| Sommers Sommers N | -- | None Available | |
| Sommers N Douglas | $219,000 | New Market Title | |
| Chima Rodrick | $159,200 | -- | |
| Hickory Hills Homes | -- | -- | |
| Casa Dev Co | -- | -- |
Source: Public Records
Mortgage History
| Date | Status | Borrower | Loan Amount |
|---|---|---|---|
| Open | Sommers Sommers N | $161,000 | |
| Closed | Sommers N Douglas | $175,200 |
Source: Public Records
Tax History Compared to Growth
Tax History
| Year | Tax Paid | Tax Assessment Tax Assessment Total Assessment is a certain percentage of the fair market value that is determined by local assessors to be the total taxable value of land and additions on the property. | Land | Improvement |
|---|---|---|---|---|
| 2024 | $6,314 | $134,470 | $23,765 | $110,705 |
| 2023 | $5,869 | $93,730 | $20,510 | $73,220 |
| 2022 | $5,826 | $93,730 | $20,510 | $73,220 |
| 2021 | $5,780 | $93,730 | $20,510 | $73,220 |
| 2020 | $5,732 | $82,220 | $17,990 | $64,230 |
| 2019 | $5,563 | $234,900 | $51,400 | $183,500 |
| 2018 | $4,952 | $82,220 | $17,990 | $64,230 |
| 2017 | $4,946 | $74,550 | $14,700 | $59,850 |
| 2016 | $4,905 | $74,550 | $14,700 | $59,850 |
| 2015 | $4,975 | $74,550 | $14,700 | $59,850 |
| 2014 | $4,975 | $74,550 | $14,700 | $59,850 |
Source: Public Records
Map
Nearby Homes
- 17682 Drake Rd
- 17024 Bear Creek Ln
- 17934 Cambridge Oval
- 18294 Drake Rd
- 18411 Yorktown Oval
- 17159 Turkey Meadow Ln
- 16486 S Red Rock Dr
- 16650 Lanier Ave
- 16711 Beech Cir
- 18848 Pearl Rd
- 17130 Golden Star Dr
- 17259 Woodshire Dr
- 18229 Howe Rd
- 18162 Fawn Cir
- 19297 Lauren Way
- 19311 Bradford Ct
- 16450 Howe Rd
- 3550 Boston Rd
- 20393 Wildwood Ln
- 18630 Shurmer Rd
- 17688 Plymouth Row
- 17632 Plymouth Row
- 17716 Plymouth Row
- 17651 Brandywine Dr
- 17677 Brandywine Dr
- 17604 Plymouth Row
- 17625 Brandywine Dr
- 17699 Brandywine Dr
- 17600 Plymouth Row
- 17744 Plymouth Row
- 17655 Plymouth Row
- 17603 Brandywine Dr
- 17627 Plymouth Row
- 17723 Brandywine Dr
- 17711 Plymouth Row
- 17772 Plymouth Row
- 17579 Brandywine Dr
- 17739 Plymouth Row
- 17745 Brandywine Dr
- 17767 Plymouth Row