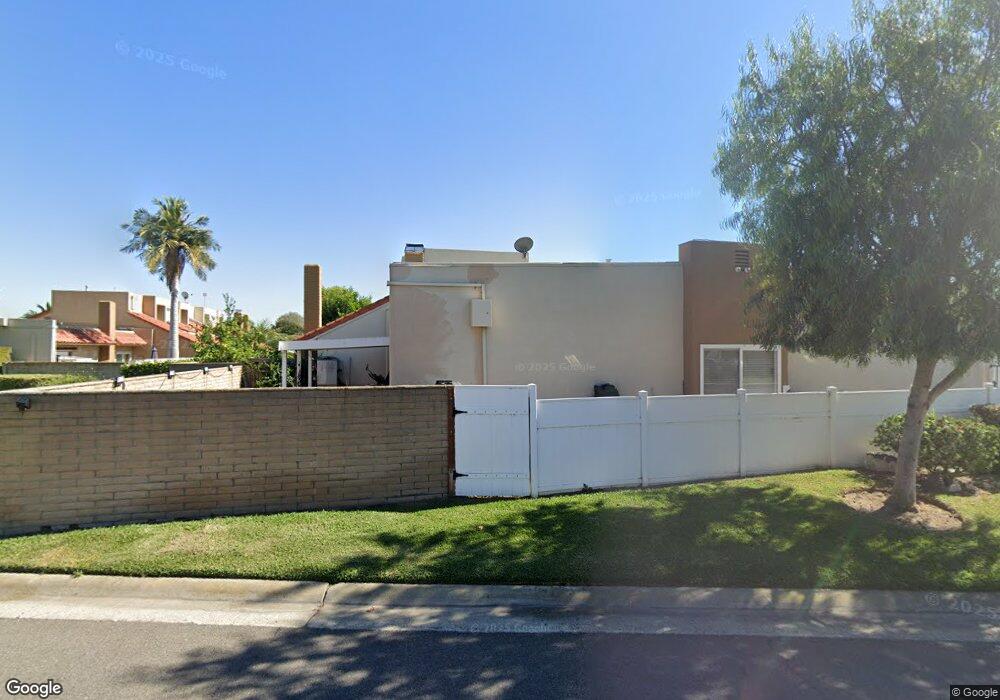
17678 La Rosa Ln Fountain Valley, CA 92708
Estimated Value: $953,000 - $1,101,000
4
Beds
2
Baths
1,546
Sq Ft
$657/Sq Ft
Est. Value
About This Home
This home is located at 17678 La Rosa Ln, Fountain Valley, CA 92708 and is currently estimated at $1,015,233, approximately $656 per square foot. 17678 La Rosa Ln is a home located in Orange County with nearby schools including Cox (James H.) Elementary School, Masuda (Kazuo) Middle School, and Fountain Valley High School.
Ownership History
Date
Name
Owned For
Owner Type
Purchase Details
Closed on
Mar 16, 2012
Sold by
Ipinza Augusto D and Ipinza Maria I
Bought by
Ipinza Augusto D and Ipinza Maria I
Current Estimated Value
Purchase Details
Closed on
Aug 8, 2007
Sold by
Ipinza Augusto D
Bought by
Ipinza Augusto D and Ipinza Maria Ines
Purchase Details
Closed on
Dec 11, 1998
Sold by
Ipinza Maria Inez
Bought by
Ipinza Augusto D
Home Financials for this Owner
Home Financials are based on the most recent Mortgage that was taken out on this home.
Original Mortgage
$138,500
Outstanding Balance
$31,677
Interest Rate
6.86%
Estimated Equity
$983,556
Purchase Details
Closed on
Mar 7, 1994
Sold by
Ipinza A M
Bought by
Ipinza Augusto D
Home Financials for this Owner
Home Financials are based on the most recent Mortgage that was taken out on this home.
Original Mortgage
$148,000
Interest Rate
7.59%
Create a Home Valuation Report for This Property
The Home Valuation Report is an in-depth analysis detailing your home's value as well as a comparison with similar homes in the area
Home Values in the Area
Average Home Value in this Area
Purchase History
| Date | Buyer | Sale Price | Title Company |
|---|---|---|---|
| Ipinza Augusto D | -- | None Available | |
| Ipinza Augusto D | -- | None Available | |
| Ipinza Augusto D | -- | Old Republic Title Company | |
| Ipinza Augusto D | -- | Gateway Title Company | |
| Ipinza Augusto D | $185,000 | Gateway Title Company |
Source: Public Records
Mortgage History
| Date | Status | Borrower | Loan Amount |
|---|---|---|---|
| Open | Ipinza Augusto D | $138,500 | |
| Closed | Ipinza Augusto D | $148,000 |
Source: Public Records
Tax History Compared to Growth
Tax History
| Year | Tax Paid | Tax Assessment Tax Assessment Total Assessment is a certain percentage of the fair market value that is determined by local assessors to be the total taxable value of land and additions on the property. | Land | Improvement |
|---|---|---|---|---|
| 2025 | $3,641 | $314,683 | $192,735 | $121,948 |
| 2024 | $3,641 | $308,513 | $188,956 | $119,557 |
| 2023 | $3,553 | $302,464 | $185,251 | $117,213 |
| 2022 | $3,497 | $296,534 | $181,619 | $114,915 |
| 2021 | $3,429 | $290,720 | $178,058 | $112,662 |
| 2020 | $3,408 | $287,740 | $176,233 | $111,507 |
| 2019 | $3,340 | $282,099 | $172,778 | $109,321 |
| 2018 | $3,277 | $276,568 | $169,390 | $107,178 |
| 2017 | $3,224 | $271,146 | $166,069 | $105,077 |
| 2016 | $3,090 | $265,830 | $162,813 | $103,017 |
| 2015 | $3,041 | $261,837 | $160,367 | $101,470 |
| 2014 | $2,980 | $256,708 | $157,225 | $99,483 |
Source: Public Records
Map
Nearby Homes
- 10430 La Cebra Ave
- 10900 La Flor Ave
- 10452 Circulo de Juarez
- 10322 Avenida Cinco de Mayo
- 10231 Bunting Ave
- 17401 Hood Ct
- 17288 San Lorenzo Cir
- 17071 Ward St
- 17210 San Mateo St Unit 25
- 17077 Los Modelos St
- 17333 Brookhurst St Unit D6
- 17333 Brookhurst St Unit B7
- 259 Albatross Ln
- 914 Ironwood Ln
- 907 Ironwood Ln
- 809 Eucalyptus Ln
- 718 Catalpa Ln
- 300 Magpie Ln
- 715 Catalpa Ln
- 620 Balsa Ln
- 17674 La Rosa Ln
- 17699 Los Jardines W
- 17670 La Rosa Ln
- 17693 Los Jardines W
- 10574 La Fuente St
- 10566 La Fuente St
- 10582 La Fuente St
- 10590 La Fuente St
- 17708 La Rosa Ln
- 17704 La Rosa Ln
- 17700 La Rosa Ln
- 17665 La Rosa Ln
- 17669 La Rosa Ln
- 17673 La Rosa Ln
- 17699 La Rosa Ln
- 17677 La Rosa Ln
- 17738 La Rosa Ln
- 10555 La Rosa Cir
- 17695 La Rosa Ln
- 10551 La Rosa Cir