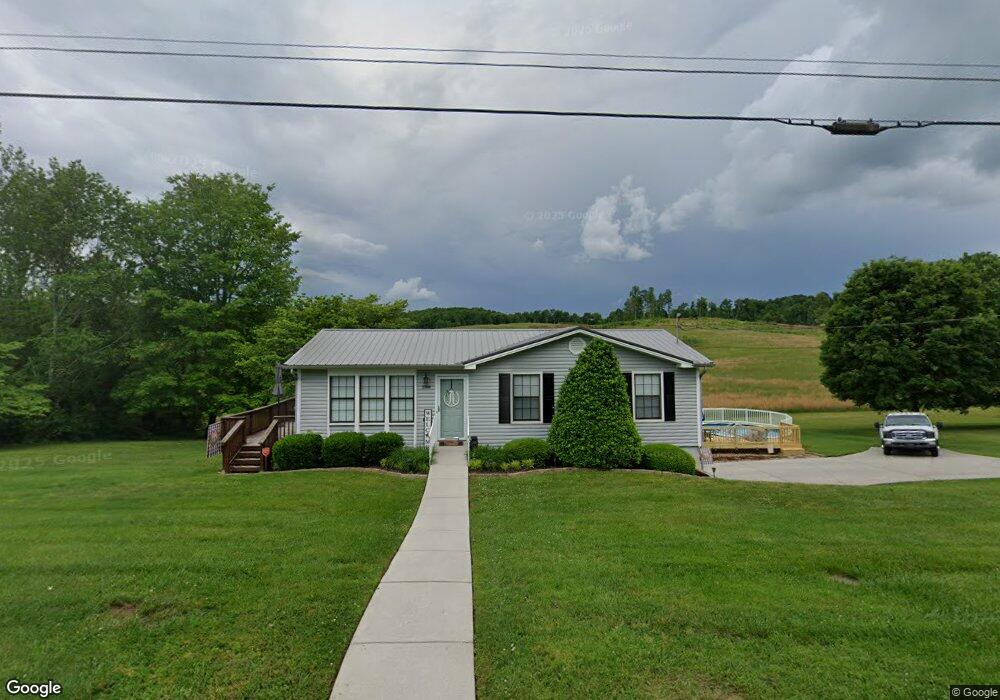
1768 Pembrook Dr Morristown, TN 37813
Estimated Value: $144,038 - $275,000
--
Bed
1
Bath
1,008
Sq Ft
$203/Sq Ft
Est. Value
About This Home
This home is located at 1768 Pembrook Dr, Morristown, TN 37813 and is currently estimated at $204,760, approximately $203 per square foot. 1768 Pembrook Dr is a home located in Hamblen County with nearby schools including Union Heights Elementary School, East Ridge Middle School, and Morristown East High School.
Ownership History
Date
Name
Owned For
Owner Type
Purchase Details
Closed on
Jul 9, 2025
Sold by
Atkins Kerri L
Bought by
Atkins Thomas E
Current Estimated Value
Home Financials for this Owner
Home Financials are based on the most recent Mortgage that was taken out on this home.
Original Mortgage
$75,000
Outstanding Balance
$74,484
Interest Rate
6.03%
Mortgage Type
New Conventional
Estimated Equity
$130,276
Purchase Details
Closed on
Jul 28, 2004
Sold by
Hinkle Elnora M Ellen
Bought by
Atkins Thomas E
Home Financials for this Owner
Home Financials are based on the most recent Mortgage that was taken out on this home.
Original Mortgage
$81,717
Interest Rate
6.22%
Purchase Details
Closed on
Jan 11, 1989
Bought by
Rose Eugene E and Rose Eutella R
Purchase Details
Closed on
Dec 27, 1988
Bought by
Rose Eugene E and Rose Eutella R
Purchase Details
Closed on
Feb 9, 1987
Bought by
Overholt Dale and Overholt Bettye
Purchase Details
Closed on
Feb 13, 1974
Bought by
Lee Van S and Lee Beulah
Create a Home Valuation Report for This Property
The Home Valuation Report is an in-depth analysis detailing your home's value as well as a comparison with similar homes in the area
Home Values in the Area
Average Home Value in this Area
Purchase History
| Date | Buyer | Sale Price | Title Company |
|---|---|---|---|
| Atkins Thomas E | -- | None Listed On Document | |
| Atkins Thomas E | -- | None Listed On Document | |
| Atkins Thomas E | $83,000 | -- | |
| Rose Eugene E | -- | -- | |
| Rose Eugene E | $44,000 | -- | |
| Overholt Dale | $3,800 | -- | |
| Lee Van S | -- | -- |
Source: Public Records
Mortgage History
| Date | Status | Borrower | Loan Amount |
|---|---|---|---|
| Open | Atkins Thomas E | $75,000 | |
| Closed | Atkins Thomas E | $75,000 | |
| Previous Owner | Lee Van S | $81,717 |
Source: Public Records
Tax History Compared to Growth
Tax History
| Year | Tax Paid | Tax Assessment Tax Assessment Total Assessment is a certain percentage of the fair market value that is determined by local assessors to be the total taxable value of land and additions on the property. | Land | Improvement |
|---|---|---|---|---|
| 2024 | $448 | $22,725 | $4,225 | $18,500 |
| 2023 | $448 | $22,725 | $0 | $0 |
| 2022 | $448 | $22,725 | $4,225 | $18,500 |
| 2021 | $448 | $22,725 | $4,225 | $18,500 |
| 2020 | $448 | $22,725 | $4,225 | $18,500 |
| 2019 | $428 | $20,075 | $2,650 | $17,425 |
| 2018 | $428 | $20,075 | $2,650 | $17,425 |
| 2017 | $428 | $20,075 | $2,650 | $17,425 |
| 2016 | $399 | $20,075 | $2,650 | $17,425 |
| 2015 | $371 | $20,075 | $2,650 | $17,425 |
| 2014 | -- | $20,075 | $2,650 | $17,425 |
| 2013 | -- | $22,375 | $0 | $0 |
Source: Public Records
Map
Nearby Homes
- 1744 Carroll Rd
- 1496 Dover Rd
- 2137 Highview Dr
- 1148 George Byrd Rd
- 1689 Carroll Rd
- 4271 Stansberry Rd
- 2205 Kingswood Dr
- 2840-2830 Robinson Creek Rd
- 1342 Slop Creek Rd
- 4581 Lockley Ct
- 4705 E Hampton Blvd
- 3080 Chucky River Rd
- 4270 Brockland Dr
- 4458 Brockland Dr
- 3661 Halifax Cir
- 1575 Thompson Creek Rd
- 0 Thompson Creek Rd
- 670 Jones Franklin Rd
- 1748 Pembrook Dr
- 1767 Pembrook Dr
- 1807 Pembrook Dr
- 1749 Pembrook Dr
- 1824 Pembrook Dr
- 1821 Pembrook Dr
- 1737 Pembrook Dr
- 1737 Pembrook Dr Unit 18
- 1732 Pembrook Dr
- 1830 Pembrook Dr
- 1831 Pembrook Dr
- 1731 Pembrook Dr
- 1840 Pembrook Dr
- 1834 Carroll Rd
- 1845 Pembrook Dr
- 1732 Carroll Rd
- 1726 Pembrook Dr
- 1850 Carroll Rd
- 1860 Pembrook Dr
- 1726 Carroll Rd