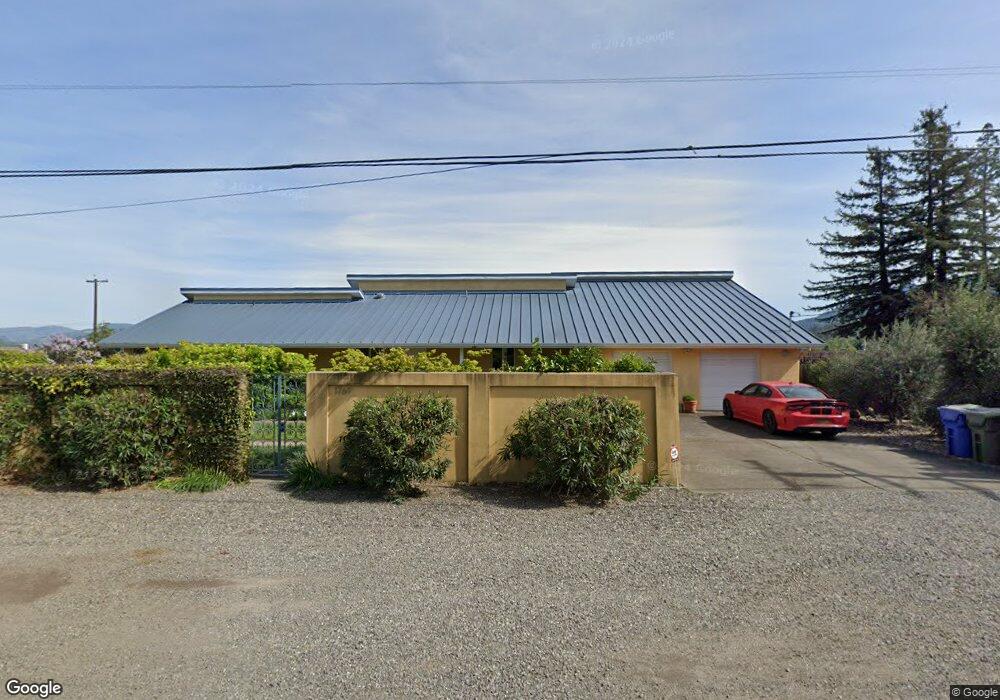
1769 Sulphur Springs Ave Saint Helena, CA 94574
Estimated Value: $1,502,000 - $2,597,000
4
Beds
3
Baths
2,893
Sq Ft
$780/Sq Ft
Est. Value
About This Home
This home is located at 1769 Sulphur Springs Ave, Saint Helena, CA 94574 and is currently estimated at $2,255,638, approximately $779 per square foot. 1769 Sulphur Springs Ave is a home located in Napa County with nearby schools including Saint Helena Primary School, Saint Helena Elementary School, and Robert Louis Stevenson Intermediate School.
Ownership History
Date
Name
Owned For
Owner Type
Purchase Details
Closed on
Jan 22, 2010
Sold by
Hall Birgit and Hall Trust
Bought by
Hall Birgit and Hall Trust
Current Estimated Value
Purchase Details
Closed on
Aug 16, 2005
Sold by
Denton Daniel W
Bought by
Hall Michael A and Hall Birgit
Home Financials for this Owner
Home Financials are based on the most recent Mortgage that was taken out on this home.
Original Mortgage
$1,100,000
Outstanding Balance
$574,126
Interest Rate
5.56%
Mortgage Type
Purchase Money Mortgage
Estimated Equity
$1,681,512
Purchase Details
Closed on
Aug 28, 2003
Sold by
Denton Daniel W and The Homer R Denton Martial Tru
Bought by
Denton Daniel W
Purchase Details
Closed on
Jul 23, 2002
Sold by
Denton Helen L and The Denton Family Trust
Bought by
Denton Helen L and The Helen L Denton Survivors T
Create a Home Valuation Report for This Property
The Home Valuation Report is an in-depth analysis detailing your home's value as well as a comparison with similar homes in the area
Home Values in the Area
Average Home Value in this Area
Purchase History
| Date | Buyer | Sale Price | Title Company |
|---|---|---|---|
| Hall Birgit | -- | None Available | |
| Hall Michael A | -- | First Amer Title Co Of Napa | |
| Denton Daniel W | -- | -- | |
| Denton Helen L | -- | -- |
Source: Public Records
Mortgage History
| Date | Status | Borrower | Loan Amount |
|---|---|---|---|
| Open | Hall Michael A | $1,100,000 |
Source: Public Records
Tax History Compared to Growth
Tax History
| Year | Tax Paid | Tax Assessment Tax Assessment Total Assessment is a certain percentage of the fair market value that is determined by local assessors to be the total taxable value of land and additions on the property. | Land | Improvement |
|---|---|---|---|---|
| 2025 | $13,176 | $1,266,066 | $275,969 | $990,097 |
| 2024 | $13,176 | $1,241,242 | $270,558 | $970,684 |
| 2023 | $13,176 | $1,216,904 | $265,253 | $951,651 |
| 2022 | $12,636 | $1,193,044 | $260,052 | $932,992 |
| 2021 | $12,467 | $1,169,652 | $254,953 | $914,699 |
| 2020 | $12,320 | $1,157,659 | $252,339 | $905,320 |
| 2019 | $12,105 | $1,134,961 | $247,392 | $887,569 |
| 2018 | $11,910 | $1,112,708 | $242,542 | $870,166 |
| 2017 | $11,687 | $1,090,891 | $237,787 | $853,104 |
| 2016 | $11,433 | $1,069,502 | $233,125 | $836,377 |
| 2015 | $11,324 | $1,053,438 | $229,624 | $823,814 |
| 2014 | $11,055 | $1,032,803 | $225,126 | $807,677 |
Source: Public Records
Map
Nearby Homes
- 22 S Crane Ave
- 1586 Arrowhead Dr
- 1594 Arrowhead Dr
- 1388 Sulphur Springs Ave
- 1316 Sulphur Springs Ave
- 256 Rosebud Ln
- 1005 Valley View St
- 2040 Olive Ave
- 2060 Olive Ave
- 1149 Hudson Ave
- 1191 Hudson Ave
- 0 Spring St
- 1003 Charter Oak Ave
- 1711 Spring St
- 1430 Wallis Ct
- 1291 Sylvaner Ave
- 1551 Spring St
- 1209 Stockton St
- 1711 Tainter St
- 1664 Spring St
- 1691 Sulphur Springs Ave
- 1791 Sulphur Springs Ave
- 1766 Sulphur Springs Ave
- 1788 Sulphur Springs Ave
- 22 Crane Ave
- 1671 Sulphur Springs Ave
- 1578 Arrowhead Dr
- 1813 Sulphur Springs Ave
- 1574 Arrowhead Dr
- 1661 Sulphur Springs Ave
- 1641 Sulphur Springs Ave
- 1833 Sulphur Springs Ave
- 1638 Sulphur Springs Ave
- 1590 Arrowhead Dr
- 1621 Sulphur Springs Ave
- 1591 Arrowhead Dr
- 1610 Sulphur Springs Ave
- 1601 Sulphur Springs Ave
- 1925 Sulphur Springs Ave