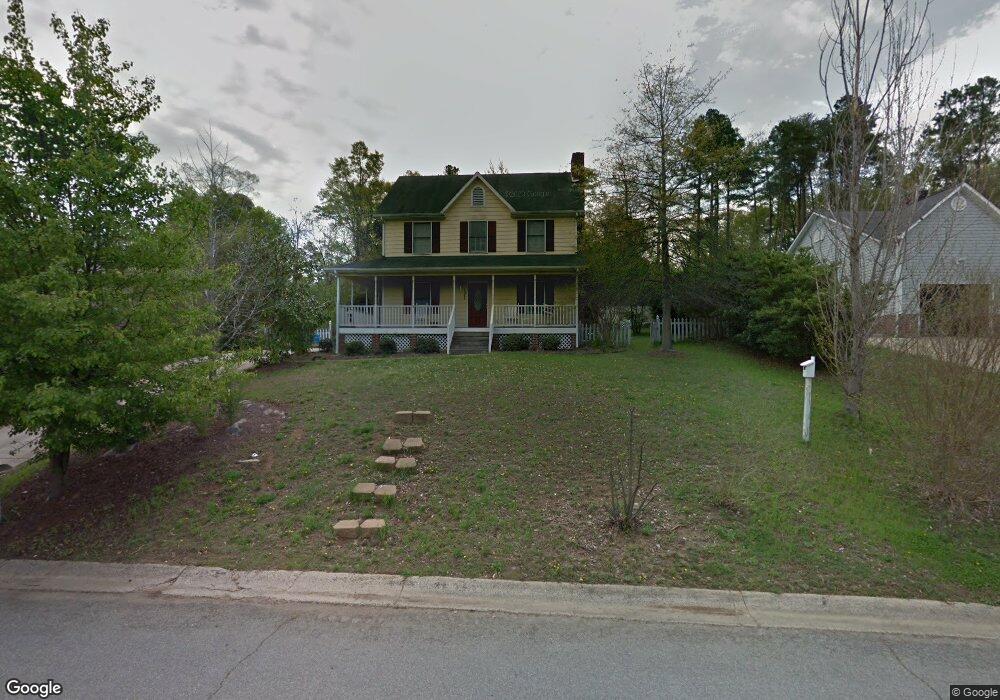
177 Antelope Dr Unit 23 Mount Holly, NC 28120
Estimated Value: $320,000 - $330,000
3
Beds
3
Baths
1,515
Sq Ft
$215/Sq Ft
Est. Value
About This Home
This home is located at 177 Antelope Dr Unit 23, Mount Holly, NC 28120 and is currently estimated at $325,746, approximately $215 per square foot. 177 Antelope Dr Unit 23 is a home located in Gaston County with nearby schools including Rankin Elementary School, Mount Holly Middle School, and Stuart W. Cramer High School.
Ownership History
Date
Name
Owned For
Owner Type
Purchase Details
Closed on
Jul 31, 2023
Sold by
Lively Eric C and Lively Maria D
Bought by
Verouden Abby Nicole
Current Estimated Value
Home Financials for this Owner
Home Financials are based on the most recent Mortgage that was taken out on this home.
Original Mortgage
$283,975
Outstanding Balance
$277,358
Interest Rate
6.69%
Mortgage Type
New Conventional
Estimated Equity
$48,388
Purchase Details
Closed on
Dec 5, 2016
Sold by
Ducit Et Munit Llc
Bought by
Lively Maria D and Lively Eric C
Home Financials for this Owner
Home Financials are based on the most recent Mortgage that was taken out on this home.
Original Mortgage
$160,047
Interest Rate
4.87%
Mortgage Type
FHA
Purchase Details
Closed on
Aug 13, 2008
Sold by
Duren Richard S and Duren Kimberly K
Bought by
Ducit Et Munit Llc
Create a Home Valuation Report for This Property
The Home Valuation Report is an in-depth analysis detailing your home's value as well as a comparison with similar homes in the area
Home Values in the Area
Average Home Value in this Area
Purchase History
| Date | Buyer | Sale Price | Title Company |
|---|---|---|---|
| Verouden Abby Nicole | $307,000 | None Listed On Document | |
| Lively Maria D | $163,000 | None Available | |
| Ducit Et Munit Llc | -- | None Available |
Source: Public Records
Mortgage History
| Date | Status | Borrower | Loan Amount |
|---|---|---|---|
| Open | Verouden Abby Nicole | $283,975 | |
| Previous Owner | Lively Maria D | $160,047 |
Source: Public Records
Tax History Compared to Growth
Tax History
| Year | Tax Paid | Tax Assessment Tax Assessment Total Assessment is a certain percentage of the fair market value that is determined by local assessors to be the total taxable value of land and additions on the property. | Land | Improvement |
|---|---|---|---|---|
| 2025 | $1,914 | $190,640 | $28,000 | $162,640 |
| 2024 | $1,914 | $190,640 | $28,000 | $162,640 |
| 2023 | $1,935 | $190,640 | $28,000 | $162,640 |
| 2022 | $2,098 | $161,980 | $24,000 | $137,980 |
| 2021 | $2,130 | $161,980 | $24,000 | $137,980 |
| 2019 | $2,146 | $161,980 | $24,000 | $137,980 |
| 2018 | $1,717 | $122,672 | $22,400 | $100,272 |
| 2017 | $1,717 | $122,672 | $22,400 | $100,272 |
| 2016 | $1,067 | $122,672 | $0 | $0 |
| 2014 | $1,184 | $136,042 | $28,000 | $108,042 |
Source: Public Records
Map
Nearby Homes
- Winslow Plan at Mooreland Oaks
- Huntley Plan at Mooreland Oaks
- Declan Plan at Mooreland Oaks
- Jasper Plan at Mooreland Oaks
- Devin Plan at Mooreland Oaks
- Montcrest Plan at Mooreland Oaks
- Riley Plan at Mooreland Oaks
- Ava Plan at Mooreland Oaks
- TA4000 Plan at Mooreland Oaks
- Kipling Plan at Mooreland Oaks
- Hudson Plan at Mooreland Oaks
- Lenox Plan at Mooreland Oaks
- Bayside Plan at Mooreland Oaks
- Cyprus Plan at Mooreland Oaks
- 112 Julia St
- 5041 Mooreland Oaks Way
- 1029 Old Nc 27 Hwy
- 157 Brookstone Dr
- 160 Brookstone Dr
- 1015 Hoover Ave
- 177 Antelope Dr
- 173 Antelope Dr
- 181 Antelope Dr
- 105 Buffalo Ct
- 169 Antelope Dr
- 224 Antelope Dr
- 108 Buffalo Ct
- 185 Antelope Dr
- 220 Antelope Dr
- 228 Antelope Dr
- 165 Antelope Dr
- 101 Buffalo Ct
- 216 Antelope Dr
- 189 Antelope Dr
- 232 Antelope Dr
- 101 Elk Ct
- 236 Antelope Dr
- 161 Antelope Dr
- 104 Buffalo Ct
- 193 Antelope Dr