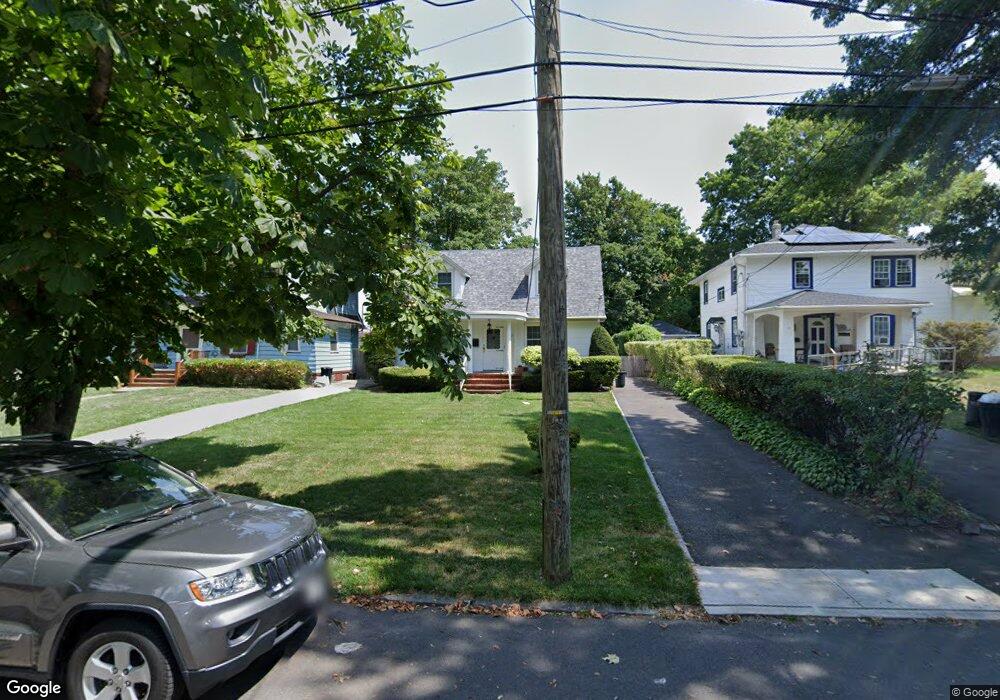
177 Tysen St Staten Island, NY 10301
New Brighton NeighborhoodEstimated Value: $557,000 - $829,000
2
Beds
1
Bath
1,350
Sq Ft
$508/Sq Ft
Est. Value
About This Home
This home is located at 177 Tysen St, Staten Island, NY 10301 and is currently estimated at $686,461, approximately $508 per square foot. 177 Tysen St is a home located in Richmond County with nearby schools including P.S. 45 John Tyler, Is 61 William A Morris, and Curtis High School.
Ownership History
Date
Name
Owned For
Owner Type
Purchase Details
Closed on
Oct 18, 2009
Sold by
Mcgann Bruce J and Mcgann Gregory D
Bought by
Curley Christopher J and Curley Loni E
Current Estimated Value
Home Financials for this Owner
Home Financials are based on the most recent Mortgage that was taken out on this home.
Original Mortgage
$409,937
Outstanding Balance
$264,661
Interest Rate
4.86%
Mortgage Type
FHA
Estimated Equity
$421,800
Purchase Details
Closed on
Jul 15, 2005
Sold by
Mcgann Vivian Anne
Bought by
Mcgann Bruce J and Mcgann Gregory D
Create a Home Valuation Report for This Property
The Home Valuation Report is an in-depth analysis detailing your home's value as well as a comparison with similar homes in the area
Home Values in the Area
Average Home Value in this Area
Purchase History
| Date | Buyer | Sale Price | Title Company |
|---|---|---|---|
| Curley Christopher J | $417,500 | None Available | |
| Mcgann Bruce J | -- | -- |
Source: Public Records
Mortgage History
| Date | Status | Borrower | Loan Amount |
|---|---|---|---|
| Open | Curley Christopher J | $409,937 |
Source: Public Records
Tax History Compared to Growth
Tax History
| Year | Tax Paid | Tax Assessment Tax Assessment Total Assessment is a certain percentage of the fair market value that is determined by local assessors to be the total taxable value of land and additions on the property. | Land | Improvement |
|---|---|---|---|---|
| 2025 | $5,997 | $43,800 | $12,400 | $31,400 |
| 2024 | $5,997 | $36,960 | $13,864 | $23,096 |
| 2023 | $6,064 | $29,860 | $13,599 | $16,261 |
| 2022 | $5,915 | $31,800 | $17,160 | $14,640 |
| 2021 | $5,883 | $33,540 | $17,160 | $16,380 |
| 2020 | $5,583 | $30,540 | $17,160 | $13,380 |
| 2019 | $5,205 | $33,120 | $17,160 | $15,960 |
| 2018 | $5,072 | $24,883 | $11,296 | $13,587 |
| 2017 | $5,034 | $24,693 | $15,353 | $9,340 |
| 2016 | $4,657 | $23,296 | $12,315 | $10,981 |
| 2015 | $3,979 | $21,979 | $10,237 | $11,742 |
| 2014 | $3,979 | $20,736 | $11,585 | $9,151 |
Source: Public Records
Map
Nearby Homes
- 148 Clinton Ave
- 152 Clinton Ave
- 125 Tysen St
- 126 Cassidy Place Unit H2
- 230 Fillmore St
- 245 Fillmore St
- 141 Lafayette Ave
- 190 W Buchanan St
- 4 Brentwood Ave
- 63 Cassidy Place
- 177 W Buchanan St Unit 79
- 180 Fillmore St
- 44 Westbury Ave
- 293 Lafayette Ave
- 132 Alden Place
- 333 Lafayette Ave
- 110 Arnold St
- 123 Pendleton Place
- 310 Brighton Ave
- 93 Arnold St