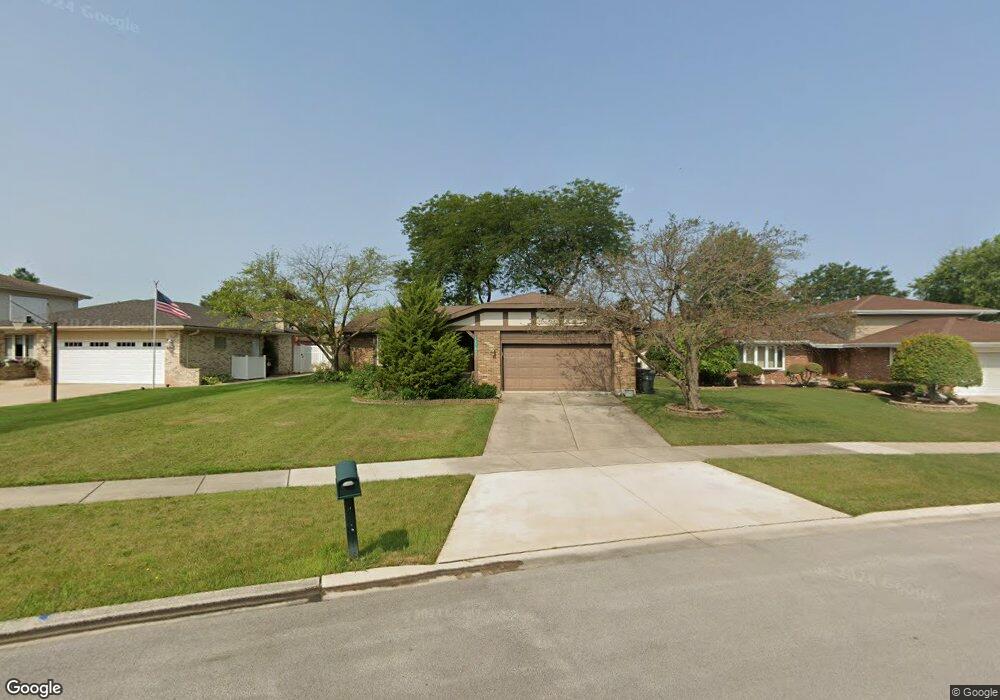
17702 Rosewood Ln Tinley Park, IL 60487
Central Tinley Park NeighborhoodEstimated Value: $400,234 - $460,000
3
Beds
2
Baths
1,802
Sq Ft
$236/Sq Ft
Est. Value
About This Home
This home is located at 17702 Rosewood Ln, Tinley Park, IL 60487 and is currently estimated at $424,559, approximately $235 per square foot. 17702 Rosewood Ln is a home located in Cook County with nearby schools including Christa Mcauliffe School, Prairie View Middle School, and Victor J Andrew High School.
Ownership History
Date
Name
Owned For
Owner Type
Purchase Details
Closed on
Sep 20, 2004
Sold by
Gaughan Daniel J and Gaughan Sheila M
Bought by
Harney Margaret M
Current Estimated Value
Home Financials for this Owner
Home Financials are based on the most recent Mortgage that was taken out on this home.
Original Mortgage
$232,000
Outstanding Balance
$115,322
Interest Rate
5.93%
Mortgage Type
Unknown
Estimated Equity
$309,237
Purchase Details
Closed on
May 7, 1999
Sold by
Founders Bank
Bought by
Gaughan Daniel J and Gaughan Sheila M
Home Financials for this Owner
Home Financials are based on the most recent Mortgage that was taken out on this home.
Original Mortgage
$104,800
Interest Rate
7.54%
Purchase Details
Closed on
Mar 12, 1998
Sold by
Szotek Raymond J and Szotek Kathy J
Bought by
Buck Norman C and Buck Geralyn M
Home Financials for this Owner
Home Financials are based on the most recent Mortgage that was taken out on this home.
Original Mortgage
$165,000
Interest Rate
7.14%
Create a Home Valuation Report for This Property
The Home Valuation Report is an in-depth analysis detailing your home's value as well as a comparison with similar homes in the area
Home Values in the Area
Average Home Value in this Area
Purchase History
| Date | Buyer | Sale Price | Title Company |
|---|---|---|---|
| Harney Margaret M | $290,000 | Ticor Title | |
| Gaughan Daniel J | $206,000 | Professional National Title | |
| Buck Norman C | $197,000 | -- |
Source: Public Records
Mortgage History
| Date | Status | Borrower | Loan Amount |
|---|---|---|---|
| Open | Harney Margaret M | $232,000 | |
| Previous Owner | Gaughan Daniel J | $104,800 | |
| Previous Owner | Buck Norman C | $165,000 |
Source: Public Records
Tax History Compared to Growth
Tax History
| Year | Tax Paid | Tax Assessment Tax Assessment Total Assessment is a certain percentage of the fair market value that is determined by local assessors to be the total taxable value of land and additions on the property. | Land | Improvement |
|---|---|---|---|---|
| 2024 | $8,797 | $35,000 | $5,635 | $29,365 |
| 2023 | $8,120 | $35,000 | $5,635 | $29,365 |
| 2022 | $8,120 | $26,198 | $4,900 | $21,298 |
| 2021 | $7,890 | $26,197 | $4,900 | $21,297 |
| 2020 | $7,761 | $26,197 | $4,900 | $21,297 |
| 2019 | $7,807 | $27,500 | $4,410 | $23,090 |
| 2018 | $7,638 | $27,500 | $4,410 | $23,090 |
| 2017 | $8,290 | $30,211 | $4,410 | $25,801 |
| 2016 | $7,296 | $24,466 | $3,920 | $20,546 |
| 2015 | $7,177 | $24,466 | $3,920 | $20,546 |
| 2014 | $7,133 | $24,466 | $3,920 | $20,546 |
| 2013 | $6,639 | $24,613 | $3,920 | $20,693 |
Source: Public Records
Map
Nearby Homes
- 17533 Pecan Ln
- 9201 175th St
- 9280 Windsor Pkwy Unit 92
- 9260 Windsor Pkwy Unit 80
- 17631 Dover Ct
- Fremont Plan at Radcliffe Place
- Calysta Plan at Radcliffe Place
- Danbury Plan at Radcliffe Place
- Briarcliffe Plan at Radcliffe Place
- Eden Plan at Radcliffe Place
- Amberwood Plan at Radcliffe Place
- 17964 Upland Dr
- 17230 Shetland Dr
- 18055 Upland Dr
- 17324 Humber Ln
- 17535 S La Grange Rd
- 17535-2 Lagrange Rd
- 17224 Briar Dr
- 9038 Mansfield Dr Unit 8
- 9051 Mansfield Dr Unit 1
- 17706 Rosewood Ln
- 17638 Rosewood Ln
- 17701 Oakwood Dr
- 17707 Oakwood Dr
- 17632 Rosewood Ln
- 17710 Rosewood Ln
- 17639 Oakwood Dr
- 17713 Oakwood Dr
- 17701 Rosewood Ln
- 17626 Rosewood Ln
- 17714 Rosewood Ln
- 17639 Rosewood Ln
- 17633 Oakwood Dr
- 17718 Rosewood Ln
- 17725 Rosewood Ln
- 17722 Rosewood Ln
- 17624 Rosewood Ln
- 17631 Rosewood Ln
- 17725 Oakwood Dr
- 9036 Oakwood Dr