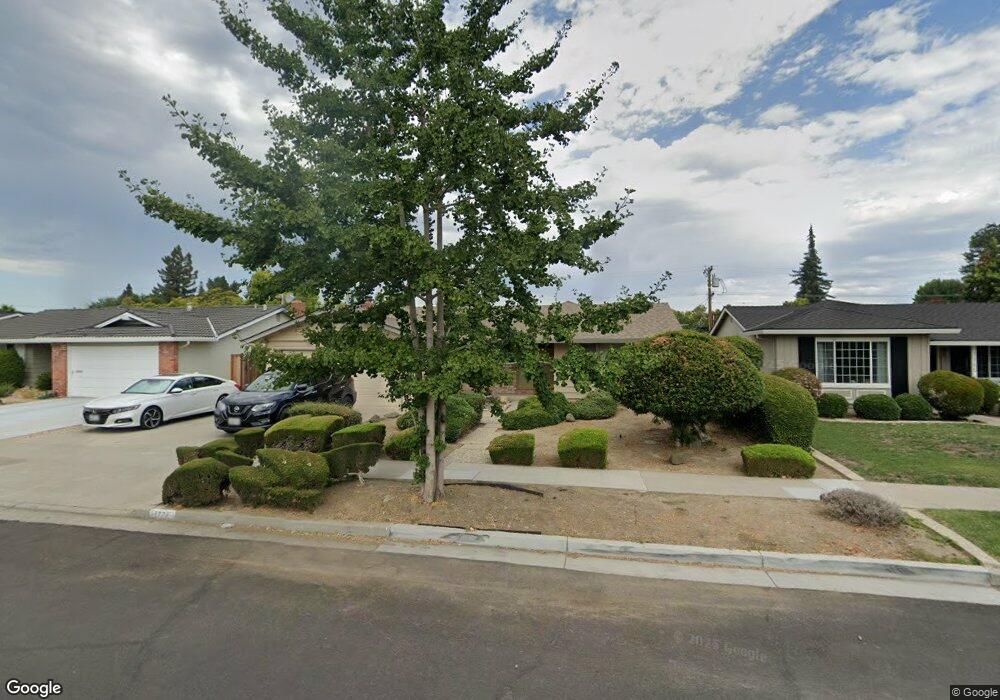
1771 Castro Dr San Jose, CA 95130
Hathaway NeighborhoodEstimated Value: $2,099,000 - $2,313,000
3
Beds
2
Baths
1,491
Sq Ft
$1,453/Sq Ft
Est. Value
About This Home
This home is located at 1771 Castro Dr, San Jose, CA 95130 and is currently estimated at $2,165,933, approximately $1,452 per square foot. 1771 Castro Dr is a home located in Santa Clara County with nearby schools including Latimer Elementary School, Moreland Middle School, and Prospect High School.
Ownership History
Date
Name
Owned For
Owner Type
Purchase Details
Closed on
Mar 7, 2007
Sold by
Etheridge Gary and Etheridge Jan
Bought by
Lai Eve
Current Estimated Value
Home Financials for this Owner
Home Financials are based on the most recent Mortgage that was taken out on this home.
Original Mortgage
$150,000
Outstanding Balance
$62,880
Interest Rate
6.29%
Mortgage Type
Credit Line Revolving
Estimated Equity
$2,103,053
Purchase Details
Closed on
Jan 16, 1996
Sold by
Etheridge Gary and Etheridge Jan
Bought by
Etheridge Gary and Etheridge Jan
Home Financials for this Owner
Home Financials are based on the most recent Mortgage that was taken out on this home.
Original Mortgage
$242,000
Interest Rate
7.5%
Purchase Details
Closed on
Jun 9, 1994
Sold by
Waddell Kevin J and Waddell Sally A
Bought by
Etheridge Gary and Etheridge Jan
Home Financials for this Owner
Home Financials are based on the most recent Mortgage that was taken out on this home.
Original Mortgage
$243,000
Interest Rate
5.87%
Create a Home Valuation Report for This Property
The Home Valuation Report is an in-depth analysis detailing your home's value as well as a comparison with similar homes in the area
Home Values in the Area
Average Home Value in this Area
Purchase History
| Date | Buyer | Sale Price | Title Company |
|---|---|---|---|
| Lai Eve | $750,000 | North American Title Company | |
| Etheridge Gary | -- | American Title Ins Co | |
| Etheridge Gary | $270,000 | American Title Insurance Co |
Source: Public Records
Mortgage History
| Date | Status | Borrower | Loan Amount |
|---|---|---|---|
| Open | Lai Eve | $150,000 | |
| Open | Lai Eve | $600,000 | |
| Previous Owner | Etheridge Gary | $242,000 | |
| Previous Owner | Etheridge Gary | $243,000 |
Source: Public Records
Tax History Compared to Growth
Tax History
| Year | Tax Paid | Tax Assessment Tax Assessment Total Assessment is a certain percentage of the fair market value that is determined by local assessors to be the total taxable value of land and additions on the property. | Land | Improvement |
|---|---|---|---|---|
| 2025 | $13,806 | $1,004,487 | $753,355 | $251,132 |
| 2024 | $13,806 | $984,792 | $738,584 | $246,208 |
| 2023 | $13,620 | $965,483 | $724,102 | $241,381 |
| 2022 | $13,418 | $946,553 | $709,904 | $236,649 |
| 2021 | $13,183 | $927,994 | $695,985 | $232,009 |
| 2020 | $12,914 | $918,480 | $688,849 | $229,631 |
| 2019 | $12,451 | $900,472 | $675,343 | $225,129 |
| 2018 | $12,151 | $882,816 | $662,101 | $220,715 |
| 2017 | $12,004 | $865,507 | $649,119 | $216,388 |
| 2016 | $11,378 | $848,538 | $636,392 | $212,146 |
| 2015 | $11,289 | $835,793 | $626,833 | $208,960 |
| 2014 | $10,683 | $819,422 | $614,555 | $204,867 |
Source: Public Records
Map
Nearby Homes
- 1918 Castro Dr
- 1607 Duvall Dr
- 1797 W Campbell Ave
- 2025 Woodglen Dr
- 115 Superior Dr
- 1803 Bucknall Rd
- 1815 Bucknall Rd
- 146 English Rose Cir
- 4497 Latimer Ave
- 4406 Norwich Way
- 84 Lavonne Dr
- 4599 Tilbury Dr
- 5043 Le Miccine Terrace Unit 76
- 1957 Colusa Way
- 2090 Elmgrove Ln
- 1370 Saratoga Ave
- 1364 Saratoga Ave
- 12890 Lantana Ave
- 2267 Fenian Dr
- 2303 Camrose Ave
- 1777 Castro Dr
- 1765 Castro Dr
- 4580 Mossbrook Cir
- 4588 Mossbrook Cir
- 1785 Castro Dr
- 4572 Mossbrook Cir
- 1759 Castro Dr
- 4596 Mossbrook Cir
- 1774 Castro Dr
- 1780 Castro Dr
- 1768 Castro Dr
- 4564 Mossbrook Cir
- 1793 Castro Dr
- 1753 Castro Dr
- 4604 Mossbrook Cir
- 1788 Castro Dr
- 1762 Castro Dr
- 1796 Castro Dr
- 4556 Mossbrook Cir
- 1756 Castro Dr