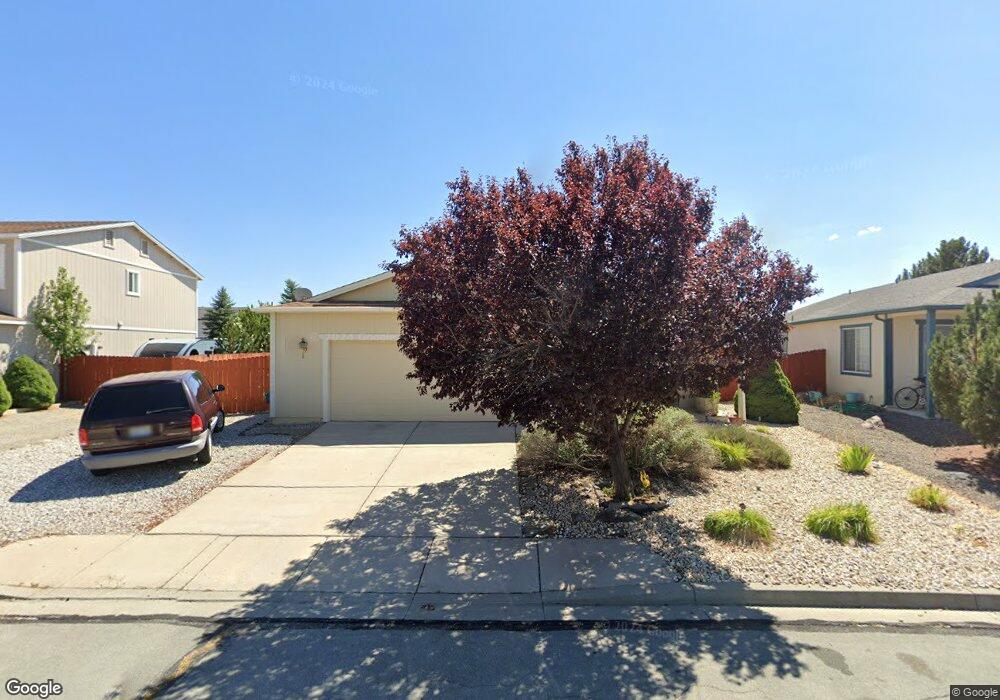
17740 Oakview Ct Reno, NV 89508
Cold Springs NeighborhoodEstimated Value: $419,000 - $442,000
3
Beds
2
Baths
1,696
Sq Ft
$255/Sq Ft
Est. Value
About This Home
This home is located at 17740 Oakview Ct, Reno, NV 89508 and is currently estimated at $432,508, approximately $255 per square foot. 17740 Oakview Ct is a home located in Washoe County with nearby schools including Cold Springs Middle Schools and North Valleys High School.
Ownership History
Date
Name
Owned For
Owner Type
Purchase Details
Closed on
Nov 16, 2007
Sold by
Williams Jo Ann
Bought by
Williams Jo Ann and Williams Malcolm A
Current Estimated Value
Home Financials for this Owner
Home Financials are based on the most recent Mortgage that was taken out on this home.
Original Mortgage
$228,000
Outstanding Balance
$144,258
Interest Rate
6.38%
Mortgage Type
New Conventional
Estimated Equity
$288,250
Purchase Details
Closed on
Oct 25, 2005
Sold by
Williams Malcolm and Williams Joann
Bought by
Williams Jo Ann
Home Financials for this Owner
Home Financials are based on the most recent Mortgage that was taken out on this home.
Original Mortgage
$217,000
Interest Rate
5.95%
Mortgage Type
Unknown
Purchase Details
Closed on
Nov 11, 2003
Sold by
Woodland Village 2002 Llc
Bought by
Williams Malcolm and Williams Joann
Home Financials for this Owner
Home Financials are based on the most recent Mortgage that was taken out on this home.
Original Mortgage
$138,205
Interest Rate
6.25%
Mortgage Type
Unknown
Create a Home Valuation Report for This Property
The Home Valuation Report is an in-depth analysis detailing your home's value as well as a comparison with similar homes in the area
Home Values in the Area
Average Home Value in this Area
Purchase History
| Date | Buyer | Sale Price | Title Company |
|---|---|---|---|
| Williams Jo Ann | -- | Stewart Title Reno | |
| Williams Jo Ann | -- | Founders Title Company Of Nv | |
| Williams Malcolm | $472,866 | First American Title |
Source: Public Records
Mortgage History
| Date | Status | Borrower | Loan Amount |
|---|---|---|---|
| Open | Williams Jo Ann | $228,000 | |
| Closed | Williams Jo Ann | $217,000 | |
| Closed | Williams Malcolm | $138,205 | |
| Closed | Williams Malcolm | $34,552 |
Source: Public Records
Tax History Compared to Growth
Tax History
| Year | Tax Paid | Tax Assessment Tax Assessment Total Assessment is a certain percentage of the fair market value that is determined by local assessors to be the total taxable value of land and additions on the property. | Land | Improvement |
|---|---|---|---|---|
| 2025 | $1,527 | $101,414 | $33,320 | $68,094 |
| 2024 | $1,527 | $95,559 | $27,020 | $68,539 |
| 2023 | $1,483 | $91,761 | $31,080 | $60,681 |
| 2022 | $1,440 | $76,607 | $26,250 | $50,357 |
| 2021 | $1,398 | $71,009 | $21,035 | $49,974 |
| 2020 | $1,356 | $70,177 | $20,125 | $50,052 |
| 2019 | $1,316 | $67,330 | $18,970 | $48,360 |
| 2018 | $1,277 | $61,031 | $13,755 | $47,276 |
| 2017 | $1,240 | $59,884 | $12,565 | $47,319 |
| 2016 | $1,210 | $58,773 | $11,410 | $47,363 |
| 2015 | $1,206 | $55,803 | $9,275 | $46,528 |
| 2014 | $1,171 | $43,408 | $7,420 | $35,988 |
| 2013 | -- | $35,093 | $5,250 | $29,843 |
Source: Public Records
Map
Nearby Homes
- 17795 Oakview Ct
- 17870 Fairfax Ct
- 17710 Fairfax Ct
- 18204 Cedar View Dr
- 18197 Almondleaf Ct
- 4040 Goldfinch Dr
- 18119 Cherryleaf Ct
- 17855 Blackbird Dr
- 17640 Lake Powell Dr
- 18520 Silverbell Ct
- 18260 Alderwood Ct
- 4000 Bobolink Cir
- Home Plan 1731 at Woodland Village
- Home Plan 2291 at Woodland Village
- Home Plan 1977 at Woodland Village
- Home Plan 2304 at Woodland Village
- 17507 Bear Lake Dr
- 3935 Rainier Ct
- 3855 Sandpiper Dr
- 17533 Javalina Ct
- 17730 Oakview Ct
- 17750 Oakview Ct
- 17745 Boxelder Ct
- 17720 Oakview Ct
- 17735 Boxelder Ct
- 17755 Boxelder Ct
- 17760 Oakview Ct
- 17745 Oakview Ct
- 17755 Oakview Ct
- 17725 Boxelder Ct
- 17765 Boxelder Ct
- 17735 Oakview Ct
- 17710 Oakview Ct
- 17770 Oakview Ct
- 17765 Oakview Ct
- 17725 Oakview Ct
- 17775 Boxelder Ct
- 17715 Boxelder Ct
- 17730 Boxelder Ct
- 17700 Oakview Ct