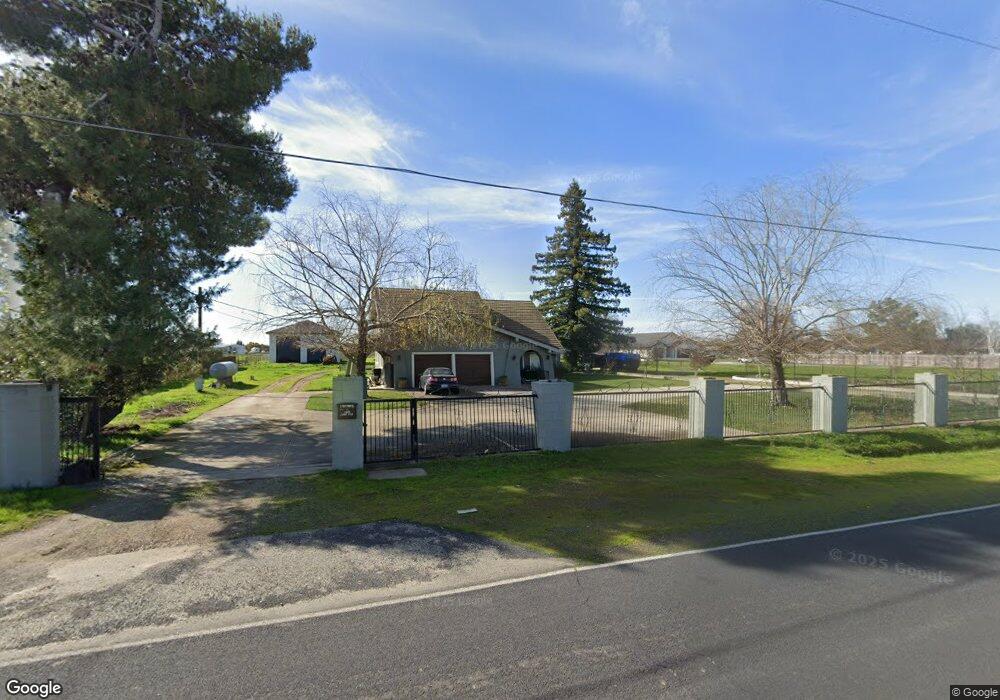
17781 N Tretheway Rd Lockeford, CA 95237
Estimated Value: $868,000 - $942,018
4
Beds
3
Baths
2,823
Sq Ft
$321/Sq Ft
Est. Value
About This Home
This home is located at 17781 N Tretheway Rd, Lockeford, CA 95237 and is currently estimated at $905,339, approximately $320 per square foot. 17781 N Tretheway Rd is a home located in San Joaquin County with nearby schools including Houston School, Lodi High School, and Point Quest Central Valley.
Ownership History
Date
Name
Owned For
Owner Type
Purchase Details
Closed on
Jan 14, 2021
Sold by
Department Of Veterans Affairs Of The St
Bought by
Horn Jimmy D and Horn Pennie A
Current Estimated Value
Home Financials for this Owner
Home Financials are based on the most recent Mortgage that was taken out on this home.
Original Mortgage
$407,300
Interest Rate
3.05%
Mortgage Type
VA
Purchase Details
Closed on
Jun 8, 2016
Sold by
Szkodzinski Pam
Bought by
The Department Of Veterans Affairs Of Th
Purchase Details
Closed on
Jun 8, 2007
Sold by
Szkodzinski Jerome J
Bought by
Szkodzinski Jerome J
Purchase Details
Closed on
Aug 11, 2005
Sold by
Szkodzinski Jerome J
Bought by
Szkodzinski Jerome J
Home Financials for this Owner
Home Financials are based on the most recent Mortgage that was taken out on this home.
Original Mortgage
$257,500
Interest Rate
5.56%
Mortgage Type
New Conventional
Create a Home Valuation Report for This Property
The Home Valuation Report is an in-depth analysis detailing your home's value as well as a comparison with similar homes in the area
Home Values in the Area
Average Home Value in this Area
Purchase History
| Date | Buyer | Sale Price | Title Company |
|---|---|---|---|
| Horn Jimmy D | -- | None Listed On Document | |
| The Department Of Veterans Affairs Of Th | $438,500 | Old Republic Title Company | |
| Szkodzinski Jerome J | -- | None Available | |
| Szkodzinski Jerome J | -- | Fidelity Natl Title Ins Co |
Source: Public Records
Mortgage History
| Date | Status | Borrower | Loan Amount |
|---|---|---|---|
| Previous Owner | Horn Jimmy D | $407,300 | |
| Previous Owner | Szkodzinski Jerome J | $257,500 |
Source: Public Records
Tax History Compared to Growth
Tax History
| Year | Tax Paid | Tax Assessment Tax Assessment Total Assessment is a certain percentage of the fair market value that is determined by local assessors to be the total taxable value of land and additions on the property. | Land | Improvement |
|---|---|---|---|---|
| 2025 | $6,626 | $574,483 | $225,150 | $349,333 |
| 2024 | $6,456 | $563,220 | $220,736 | $342,484 |
| 2023 | $6,233 | $552,177 | $216,408 | $335,769 |
| 2022 | $6,306 | $541,351 | $212,165 | $329,186 |
| 2021 | $6,206 | $530,737 | $208,005 | $322,732 |
| 2020 | $6,051 | $525,296 | $205,873 | $319,423 |
| 2019 | $5,934 | $514,997 | $201,837 | $313,160 |
| 2018 | $5,854 | $504,900 | $197,880 | $307,020 |
| 2017 | $5,729 | $495,000 | $194,000 | $301,000 |
| 2016 | $2,107 | $186,579 | $32,615 | $153,964 |
| 2014 | $2,068 | $180,177 | $31,496 | $148,681 |
Source: Public Records
Map
Nearby Homes
- 17251 N Tretheway Rd Unit 7
- 11900 E Brandt Rd
- 16795 N Manor Ln
- 17010 N Locust Tree Rd
- 9403 Kirschenman Rd
- 6233 E Woodbridge Rd
- 12718 Locke Rd
- 18450 N Highway 88 Unit 7A
- 17490 N Bruella Rd
- 18385 Milford Dr
- 15296 N Highway 88
- 17036 N Locust Tree Rd
- 15155 N Curry Ave
- 19991 N Tretheway Rd
- 14700 N Locust Tree Rd
- 21167 N Tretheway Rd
- 14334 E Prospect Place
- 14370 E Prospect Place
- 9417 E Orchard Rd
- 8275 E Orchard Rd Unit E
- 17835 N Tretheway Rd
- 17643 N Tretheway Rd
- 0 Locke Rd
- 17891 N Tretheway Rd
- 17551 N Tretheway Rd
- 17832 N Tretheway Rd
- 17451 N Tretheway Rd
- 17510 N Tretheway Rd
- 17985 N Tretheway Rd
- 11308 E Brandt Rd
- 17403 N Tretheway Rd
- 17400 N Tretheway Rd
- 18018 N Tretheway Rd
- 17680 Kroll Rd
- 17311 N Tretheway Rd
- 11320 E Brandt Rd
- 17340 N Tretheway Rd
- 18129 N Tretheway Rd
- 17316 N Tretheway Rd
- 10943 E Highway 12