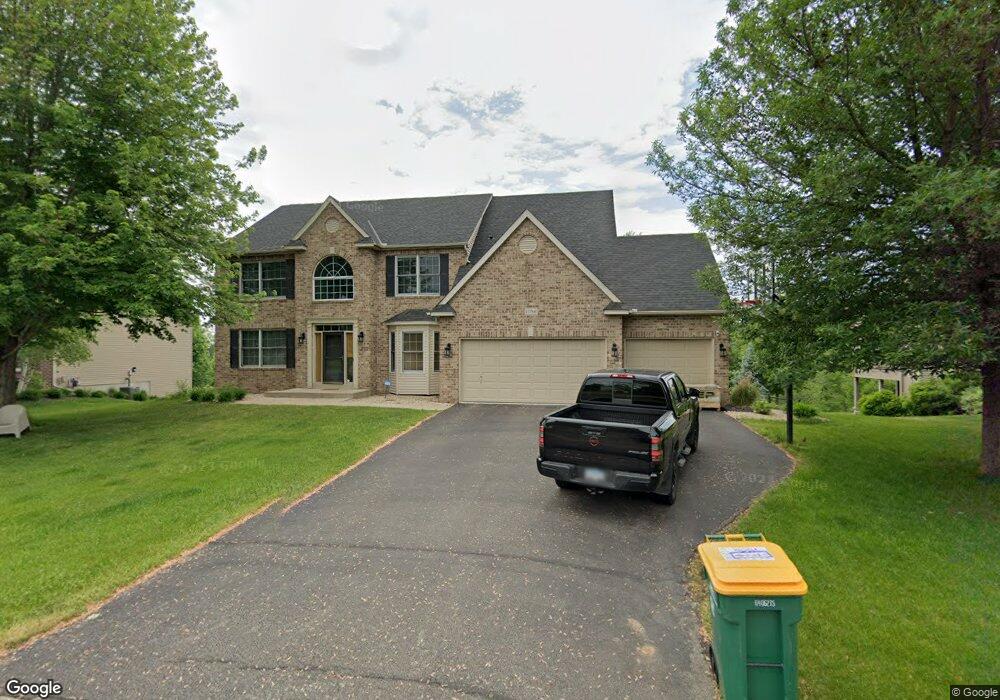
17784 Hickory Trail Lakeville, MN 55044
Estimated Value: $663,000 - $713,000
5
Beds
4
Baths
4,452
Sq Ft
$156/Sq Ft
Est. Value
About This Home
This home is located at 17784 Hickory Trail, Lakeville, MN 55044 and is currently estimated at $695,190, approximately $156 per square foot. 17784 Hickory Trail is a home located in Dakota County with nearby schools including Cherry View Elementary School, Century Middle School, and Lakeville North High School.
Ownership History
Date
Name
Owned For
Owner Type
Purchase Details
Closed on
Mar 24, 2022
Sold by
Pedersen Jill and Pedersen Douglas
Bought by
Chen Chi
Current Estimated Value
Home Financials for this Owner
Home Financials are based on the most recent Mortgage that was taken out on this home.
Original Mortgage
$508,000
Outstanding Balance
$473,389
Interest Rate
3.69%
Mortgage Type
New Conventional
Estimated Equity
$221,801
Purchase Details
Closed on
Jul 29, 2016
Sold by
Miller Gregory M and Miller Julie M
Bought by
Moen Jill L
Home Financials for this Owner
Home Financials are based on the most recent Mortgage that was taken out on this home.
Original Mortgage
$94,000
Interest Rate
3.56%
Mortgage Type
New Conventional
Purchase Details
Closed on
Sep 21, 2007
Sold by
Finney Michael F
Bought by
Miller Gregory M and Van Heel Julie M
Purchase Details
Closed on
Mar 28, 2002
Sold by
Inc-Minnesota D R Horton
Bought by
Finney Michael F and Finney Lori J
Create a Home Valuation Report for This Property
The Home Valuation Report is an in-depth analysis detailing your home's value as well as a comparison with similar homes in the area
Home Values in the Area
Average Home Value in this Area
Purchase History
| Date | Buyer | Sale Price | Title Company |
|---|---|---|---|
| Chen Chi | $668,000 | -- | |
| Moen Jill L | $455,000 | Dca Title | |
| Miller Gregory M | $462,500 | -- | |
| Finney Michael F | $362,887 | -- |
Source: Public Records
Mortgage History
| Date | Status | Borrower | Loan Amount |
|---|---|---|---|
| Open | Chen Chi | $508,000 | |
| Previous Owner | Moen Jill L | $94,000 |
Source: Public Records
Tax History Compared to Growth
Tax History
| Year | Tax Paid | Tax Assessment Tax Assessment Total Assessment is a certain percentage of the fair market value that is determined by local assessors to be the total taxable value of land and additions on the property. | Land | Improvement |
|---|---|---|---|---|
| 2024 | $7,312 | $632,500 | $125,500 | $507,000 |
| 2023 | $7,312 | $643,300 | $125,100 | $518,200 |
| 2022 | $6,170 | $622,900 | $124,700 | $498,200 |
| 2021 | $5,802 | $520,000 | $108,500 | $411,500 |
| 2020 | $6,036 | $475,500 | $100,500 | $375,000 |
| 2019 | $5,550 | $468,500 | $95,700 | $372,800 |
| 2018 | $5,566 | $444,900 | $91,200 | $353,700 |
| 2017 | $5,485 | $437,800 | $86,800 | $351,000 |
| 2016 | $5,770 | $425,900 | $82,600 | $343,300 |
| 2015 | $5,514 | $425,800 | $80,200 | $345,600 |
| 2014 | -- | $424,300 | $78,000 | $346,300 |
| 2013 | -- | $381,102 | $70,997 | $310,105 |
Source: Public Records
Map
Nearby Homes
- McKinley Plan at Caslano
- Lewis Plan at Caslano
- Sinclair Plan at Caslano
- 8705 183rd St W
- Clearwater Plan at Caslano
- Washburn Plan at Caslano
- Snelling Plan at Caslano
- Itasca Plan at Caslano
- 18072 Hyde Park Ave
- 18017 Hidden Creek Trail
- 18211 Huntley Trail
- 17990 Hidden Creek Trail
- 9079 179th St W
- 17953 Hidden Creek Trail
- 17949 Hidden Creek Trail
- 18171 Hideaway Trail
- 9151 179th St W
- Morgan Plan at Highview Ridge
- Parkland Plan at Highview Ridge
- Charleswood II & III Plan at Highview Ridge
- 17786 Hickory Trail
- 17782 Hickory Trail
- 17788 Hickory Trail
- 17780 Hickory Trail
- 17783 Hickory Trail
- 17785 Hickory Trail
- 17779 Hickory Trail
- 17790 Hickory Trail
- 17778 Hickory Trail
- 17787 Hickory Trail
- 17777 Hickory Trail
- 8902 177th St W
- 17792 Hickory Trail
- 17804 Hydrangea Ln
- 17789 Hickory Trail
- 8906 177th St W
- 17776 Hickory Trail
- 8910 177th St W
- 17727 Hillwood Ave
- 8914 177th St W