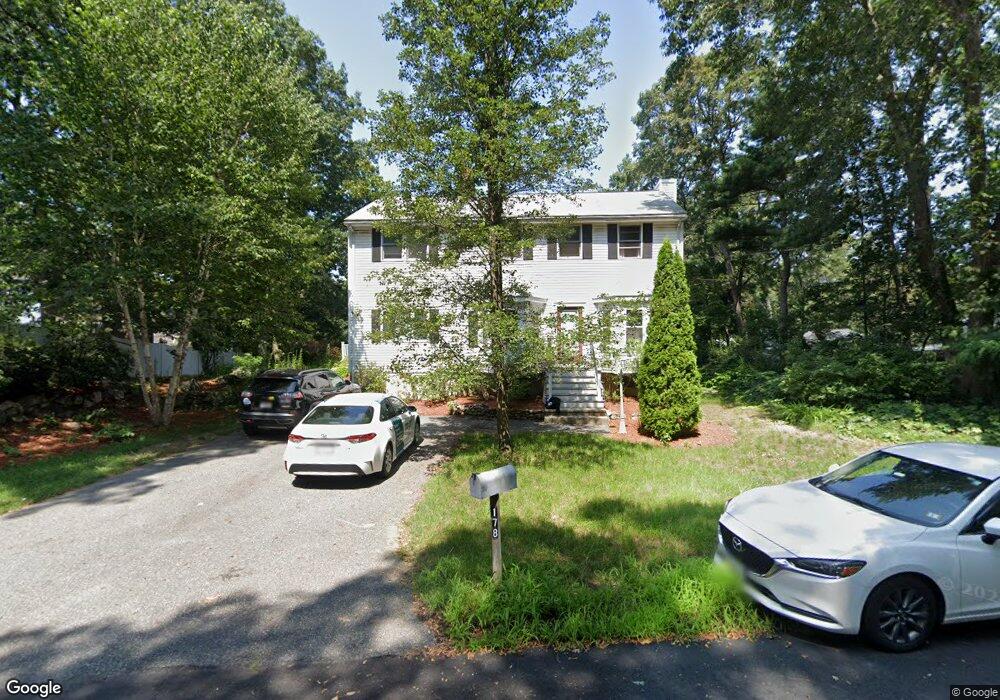
178 Taft Rd Wilmington, MA 01887
Estimated Value: $920,000 - $1,202,000
3
Beds
3
Baths
3,102
Sq Ft
$329/Sq Ft
Est. Value
About This Home
This home is located at 178 Taft Rd, Wilmington, MA 01887 and is currently estimated at $1,021,163, approximately $329 per square foot. 178 Taft Rd is a home located in Middlesex County with nearby schools including Wilmington Middle School, Wilmington High School, and Abundant Life Christian School and Childcare.
Ownership History
Date
Name
Owned For
Owner Type
Purchase Details
Closed on
Jul 18, 2016
Sold by
Stukey Mary and Stkey Derek J
Bought by
Stukey Derek
Current Estimated Value
Purchase Details
Closed on
Nov 9, 2006
Sold by
Fallon Mary Kay and Stukey Mary Kay
Bought by
Beaupre James T
Purchase Details
Closed on
Oct 10, 2006
Sold by
Fallon Mary Kay and Stukey Mary Kay
Bought by
Stukey Mary Kay
Create a Home Valuation Report for This Property
The Home Valuation Report is an in-depth analysis detailing your home's value as well as a comparison with similar homes in the area
Home Values in the Area
Average Home Value in this Area
Purchase History
| Date | Buyer | Sale Price | Title Company |
|---|---|---|---|
| Stukey Derek | -- | -- | |
| Beaupre James T | -- | -- | |
| Stukey Mary Kay | -- | -- |
Source: Public Records
Tax History Compared to Growth
Tax History
| Year | Tax Paid | Tax Assessment Tax Assessment Total Assessment is a certain percentage of the fair market value that is determined by local assessors to be the total taxable value of land and additions on the property. | Land | Improvement |
|---|---|---|---|---|
| 2025 | $9,832 | $858,700 | $312,100 | $546,600 |
| 2024 | $9,584 | $838,500 | $312,100 | $526,400 |
| 2023 | $8,953 | $749,800 | $283,800 | $466,000 |
| 2022 | $8,446 | $648,200 | $236,400 | $411,800 |
| 2021 | $8,503 | $614,400 | $214,900 | $399,500 |
| 2020 | $8,311 | $612,000 | $214,900 | $397,100 |
| 2019 | $8,161 | $593,500 | $204,600 | $388,900 |
| 2018 | $8,057 | $559,100 | $194,900 | $364,200 |
| 2017 | $7,874 | $544,900 | $194,900 | $350,000 |
| 2016 | $7,338 | $501,600 | $185,700 | $315,900 |
| 2015 | $7,059 | $491,200 | $185,700 | $305,500 |
| 2014 | $6,570 | $461,400 | $176,900 | $284,500 |
Source: Public Records
Map
Nearby Homes