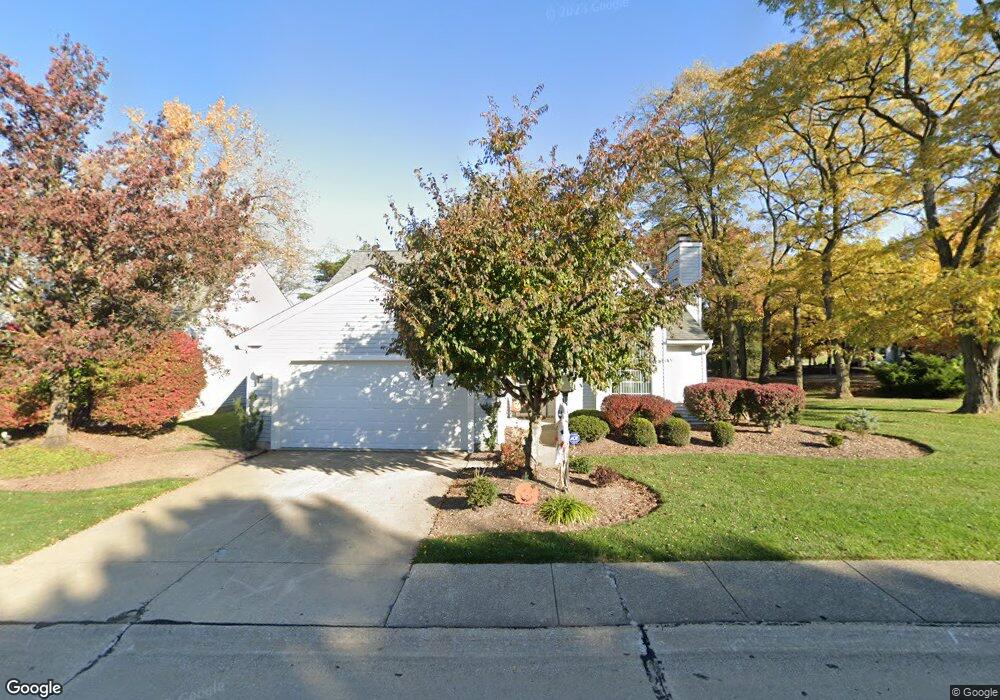
17800 Framingham Oval Strongsville, OH 44136
Estimated Value: $299,000 - $308,000
2
Beds
3
Baths
1,712
Sq Ft
$176/Sq Ft
Est. Value
About This Home
This home is located at 17800 Framingham Oval, Strongsville, OH 44136 and is currently estimated at $302,024, approximately $176 per square foot. 17800 Framingham Oval is a home located in Cuyahoga County with nearby schools including Strongsville High School and Sts Joseph & John Interparochial School.
Ownership History
Date
Name
Owned For
Owner Type
Purchase Details
Closed on
Mar 9, 2016
Sold by
Agnese Lori D D and Vajdich Carl
Bought by
Benson Dale W and Benson Toniann
Current Estimated Value
Purchase Details
Closed on
Apr 26, 2006
Sold by
Jonas Janet E
Bought by
Dagnese Lori D
Home Financials for this Owner
Home Financials are based on the most recent Mortgage that was taken out on this home.
Original Mortgage
$177,900
Interest Rate
6.37%
Mortgage Type
Fannie Mae Freddie Mac
Purchase Details
Closed on
Jul 13, 2002
Sold by
Smith John E and Smith Donna L
Bought by
Jonas Janet E
Home Financials for this Owner
Home Financials are based on the most recent Mortgage that was taken out on this home.
Original Mortgage
$72,000
Interest Rate
6.7%
Purchase Details
Closed on
Mar 27, 2001
Sold by
Kinkopf Karen L
Bought by
Smith John E and Smith Donna L
Purchase Details
Closed on
Aug 25, 1988
Bought by
Kinkopf Karen L
Purchase Details
Closed on
Jan 1, 1987
Bought by
Framingham Group Inc
Create a Home Valuation Report for This Property
The Home Valuation Report is an in-depth analysis detailing your home's value as well as a comparison with similar homes in the area
Home Values in the Area
Average Home Value in this Area
Purchase History
| Date | Buyer | Sale Price | Title Company |
|---|---|---|---|
| Benson Dale W | $150,000 | Chicago Title Insurance Co | |
| Dagnese Lori D | $182,000 | First American Title Ins Co | |
| Jonas Janet E | $167,000 | Resource Title Agency Inc | |
| Smith John E | $125,000 | American Title & Trust Agenc | |
| Kinkopf Karen L | $134,500 | -- | |
| Framingham Group Inc | -- | -- |
Source: Public Records
Mortgage History
| Date | Status | Borrower | Loan Amount |
|---|---|---|---|
| Previous Owner | Dagnese Lori D | $177,900 | |
| Previous Owner | Jonas Janet E | $72,000 |
Source: Public Records
Tax History Compared to Growth
Tax History
| Year | Tax Paid | Tax Assessment Tax Assessment Total Assessment is a certain percentage of the fair market value that is determined by local assessors to be the total taxable value of land and additions on the property. | Land | Improvement |
|---|---|---|---|---|
| 2024 | $3,929 | $83,685 | $22,085 | $61,600 |
| 2023 | $3,719 | $59,400 | $19,010 | $40,390 |
| 2022 | $3,692 | $59,400 | $19,010 | $40,390 |
| 2021 | $3,663 | $59,400 | $19,010 | $40,390 |
| 2020 | $3,630 | $52,080 | $16,660 | $35,420 |
| 2019 | $3,524 | $148,800 | $47,600 | $101,200 |
| 2018 | $3,198 | $52,080 | $16,660 | $35,420 |
| 2017 | $3,483 | $52,500 | $13,650 | $38,850 |
| 2016 | $3,454 | $52,500 | $13,650 | $38,850 |
| 2015 | $3,966 | $60,900 | $13,650 | $47,250 |
| 2014 | $4,064 | $60,900 | $13,650 | $47,250 |
Source: Public Records
Map
Nearby Homes
- 17934 Cambridge Oval
- 17682 Drake Rd
- 18294 Drake Rd
- 18411 Yorktown Oval
- 17024 Bear Creek Ln
- 17159 Turkey Meadow Ln
- 18848 Pearl Rd
- 16486 S Red Rock Dr
- 17259 Woodshire Dr
- 16650 Lanier Ave
- 16711 Beech Cir
- 19297 Lauren Way
- 18162 Fawn Cir
- 17130 Golden Star Dr
- 19311 Bradford Ct
- 18229 Howe Rd
- 20393 Wildwood Ln
- 16450 Howe Rd
- 20114 Drake Rd
- 18630 Shurmer Rd
- 17848 Framingham Oval
- 17803 Framingham Oval
- 17827 Framingham Oval
- 17872 Framingham Oval
- 17772 Plymouth Row
- 17896 Framingham Oval
- 17875 Framingham Oval
- 17744 Plymouth Row
- 17767 Plymouth Row
- 17771 Lexington Ln
- 17745 Brandywine Dr
- 17920 Framingham Oval
- 17739 Plymouth Row
- 17716 Plymouth Row
- 17723 Brandywine Dr
- 17749 Lexington Ln
- 17944 Framingham Oval
- 17923 Framingham Oval
- 17722 Lexington Ln
- 17806 Brandywine Dr