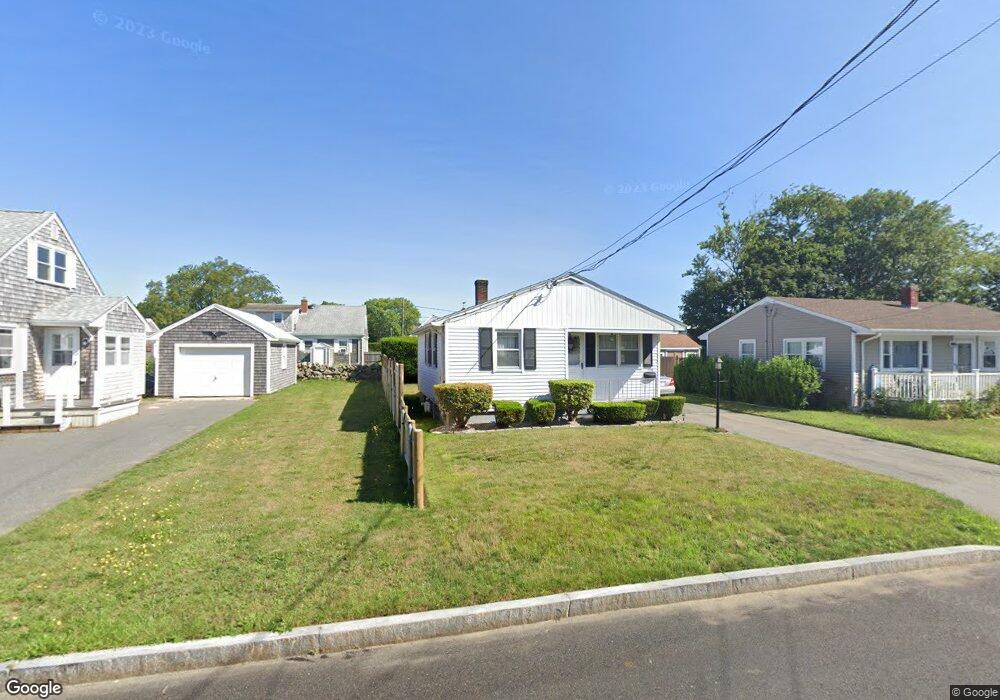
179 Portland St New Bedford, MA 02744
The South End NeighborhoodEstimated Value: $326,000 - $353,962
1
Bed
1
Bath
624
Sq Ft
$548/Sq Ft
Est. Value
About This Home
This home is located at 179 Portland St, New Bedford, MA 02744 and is currently estimated at $341,991, approximately $548 per square foot. 179 Portland St is a home located in Bristol County with nearby schools including William H. Taylor Elementary School, Roosevelt Middle School, and New Bedford High School.
Ownership History
Date
Name
Owned For
Owner Type
Purchase Details
Closed on
Dec 30, 2002
Sold by
Dossantos Manuel
Bought by
Samson Jason J
Current Estimated Value
Home Financials for this Owner
Home Financials are based on the most recent Mortgage that was taken out on this home.
Original Mortgage
$110,000
Outstanding Balance
$46,927
Interest Rate
6.02%
Mortgage Type
Purchase Money Mortgage
Estimated Equity
$295,064
Purchase Details
Closed on
Nov 12, 1999
Sold by
Freitas Lillian M
Bought by
Dossantos Manuel
Purchase Details
Closed on
May 2, 1990
Sold by
Andrews George T
Bought by
Freitas Lillian M
Create a Home Valuation Report for This Property
The Home Valuation Report is an in-depth analysis detailing your home's value as well as a comparison with similar homes in the area
Home Values in the Area
Average Home Value in this Area
Purchase History
| Date | Buyer | Sale Price | Title Company |
|---|---|---|---|
| Samson Jason J | $143,000 | -- | |
| Samson Jason J | $143,000 | -- | |
| Dossantos Manuel | $80,000 | -- | |
| Dossantos Manuel | $80,000 | -- | |
| Freitas Lillian M | $110,000 | -- | |
| Freitas Lillian M | $110,000 | -- |
Source: Public Records
Mortgage History
| Date | Status | Borrower | Loan Amount |
|---|---|---|---|
| Open | Freitas Lillian M | $7,000 | |
| Open | Freitas Lillian M | $110,000 | |
| Closed | Freitas Lillian M | $110,000 |
Source: Public Records
Tax History Compared to Growth
Tax History
| Year | Tax Paid | Tax Assessment Tax Assessment Total Assessment is a certain percentage of the fair market value that is determined by local assessors to be the total taxable value of land and additions on the property. | Land | Improvement |
|---|---|---|---|---|
| 2025 | $3,494 | $308,900 | $114,700 | $194,200 |
| 2024 | $3,118 | $259,800 | $108,000 | $151,800 |
| 2023 | $3,155 | $220,800 | $93,100 | $127,700 |
| 2022 | $2,844 | $183,000 | $84,700 | $98,300 |
| 2021 | $3,937 | $179,600 | $84,700 | $94,900 |
| 2020 | $3,857 | $173,300 | $84,700 | $88,600 |
| 2019 | $2,711 | $164,600 | $84,700 | $79,900 |
| 2018 | $7,030 | $154,300 | $84,700 | $69,600 |
| 2017 | $2,483 | $148,800 | $84,700 | $64,100 |
| 2016 | $2,294 | $139,100 | $81,400 | $57,700 |
| 2015 | $2,089 | $132,800 | $76,400 | $56,400 |
| 2014 | $2,019 | $133,200 | $76,400 | $56,800 |
Source: Public Records
Map
Nearby Homes