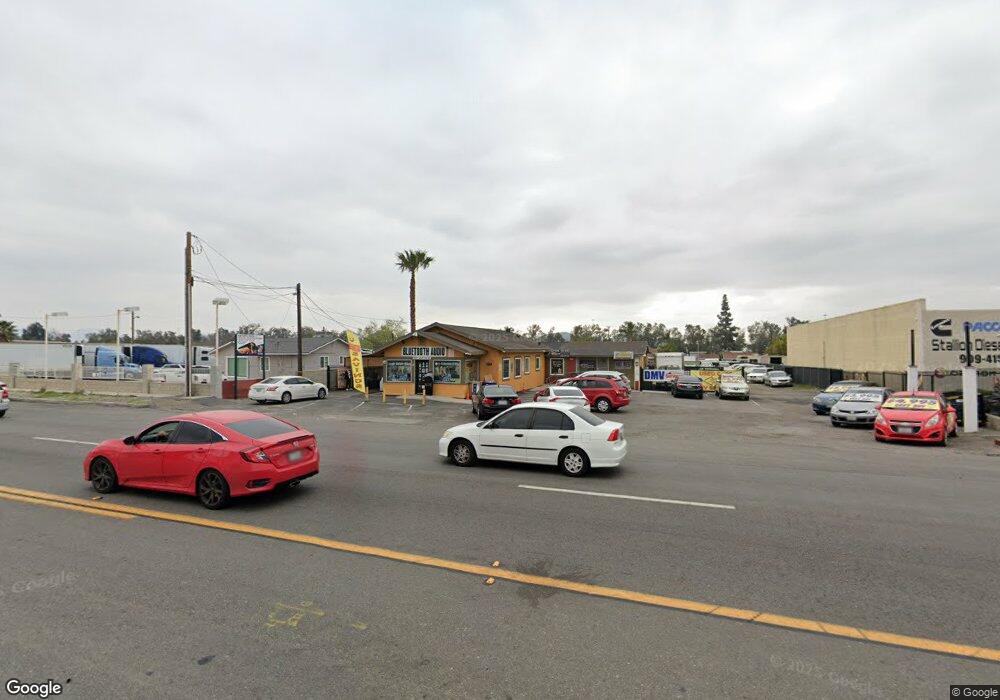
17921 Valley Blvd Bloomington, CA 92316
Estimated Value: $740,376
1
Bed
3
Baths
592
Sq Ft
$1,251/Sq Ft
Est. Value
About This Home
This home is located at 17921 Valley Blvd, Bloomington, CA 92316 and is currently estimated at $740,376, approximately $1,250 per square foot. 17921 Valley Blvd is a home located in San Bernardino County with nearby schools including Mary B. Lewis Elementary School, Joe Baca, and Bloomington High School.
Ownership History
Date
Name
Owned For
Owner Type
Purchase Details
Closed on
Aug 16, 2019
Sold by
Salman Ramzi
Bought by
Salman Ramzi
Current Estimated Value
Purchase Details
Closed on
Feb 9, 2015
Sold by
Jlm Enterprise Llc
Bought by
Salman Ramzi Hanna
Home Financials for this Owner
Home Financials are based on the most recent Mortgage that was taken out on this home.
Original Mortgage
$225,000
Outstanding Balance
$171,309
Interest Rate
3.6%
Mortgage Type
Commercial
Estimated Equity
$569,067
Purchase Details
Closed on
Jul 19, 2013
Sold by
Eyestone Jack Wayne and Eyestone Margaret M
Bought by
Jlm Enterprise Llc
Home Financials for this Owner
Home Financials are based on the most recent Mortgage that was taken out on this home.
Original Mortgage
$140,000
Interest Rate
4.46%
Mortgage Type
Commercial
Create a Home Valuation Report for This Property
The Home Valuation Report is an in-depth analysis detailing your home's value as well as a comparison with similar homes in the area
Home Values in the Area
Average Home Value in this Area
Purchase History
| Date | Buyer | Sale Price | Title Company |
|---|---|---|---|
| Salman Ramzi | -- | None Available | |
| Salman Ramzi Hanna | $350,000 | Fidelity National Title Co | |
| Jlm Enterprise Llc | $210,000 | Fidelity National Title Co |
Source: Public Records
Mortgage History
| Date | Status | Borrower | Loan Amount |
|---|---|---|---|
| Open | Salman Ramzi Hanna | $225,000 | |
| Previous Owner | Jlm Enterprise Llc | $140,000 |
Source: Public Records
Tax History Compared to Growth
Tax History
| Year | Tax Paid | Tax Assessment Tax Assessment Total Assessment is a certain percentage of the fair market value that is determined by local assessors to be the total taxable value of land and additions on the property. | Land | Improvement |
|---|---|---|---|---|
| 2025 | $5,162 | $420,649 | $396,612 | $24,037 |
| 2024 | $5,162 | $412,401 | $388,835 | $23,566 |
| 2023 | $5,171 | $404,315 | $381,211 | $23,104 |
| 2022 | $5,095 | $396,387 | $373,736 | $22,651 |
| 2021 | $5,191 | $388,615 | $366,408 | $22,207 |
| 2020 | $7,547 | $563,000 | $384,202 | $178,798 |
| 2019 | $5,071 | $377,088 | $355,540 | $21,548 |
| 2018 | $4,834 | $369,694 | $348,569 | $21,125 |
| 2017 | $3,319 | $257,724 | $232,374 | $25,350 |
| 2016 | $3,403 | $252,671 | $227,818 | $24,853 |
| 2015 | $3,295 | $248,876 | $224,396 | $24,480 |
| 2014 | $3,180 | $244,000 | $220,000 | $24,000 |
Source: Public Records
Map
Nearby Homes
- 18042 Marygold Ave
- 9838 Alder Ave
- 17514 Valley Blvd
- 9823 Lombardy Ave
- 18325 El Molino St
- 9649 Grace St
- 17455 Marygold Ave
- 17377 Valley Blvd Unit 19
- 17377 Valley Blvd Unit 43
- 9562 Locust Ave
- 17400 Valley Blvd Unit 43
- 17400 Valley Blvd Unit 6
- 9824 Linden Ave
- 17333 Valley Blvd Unit 15E
- 17225 Valley Blvd Unit 59
- 17333 Valley Blvd Unit 44E
- 17333 Valley Blvd Unit 103
- 17333 Valley Blvd Unit 41E
- 17225 Valley Blvd Unit 10
- 17333 Valley Blvd Unit 36A
- 17903 Valley Blvd
- 17908 Taylor Ave
- 17955 Valley Blvd
- 17863 Valley Blvd
- 17898 Taylor Ave
- 17933 Valley Blvd
- 17888 Taylor Ave
- 17876 Taylor Ave
- 17991 Valley Blvd
- 17897 Taylor Ave
- 17907 Taylor Ave
- 17906 Valley Blvd
- 17953 Taylor Ave
- 17848 Taylor Ave
- 17998 Taylor Ave
- 17939 Taylor Ave
- 17969 Taylor Ave
- 17895 Taylor Ave
- 17832 Taylor Ave
- 17973 Taylor Ave