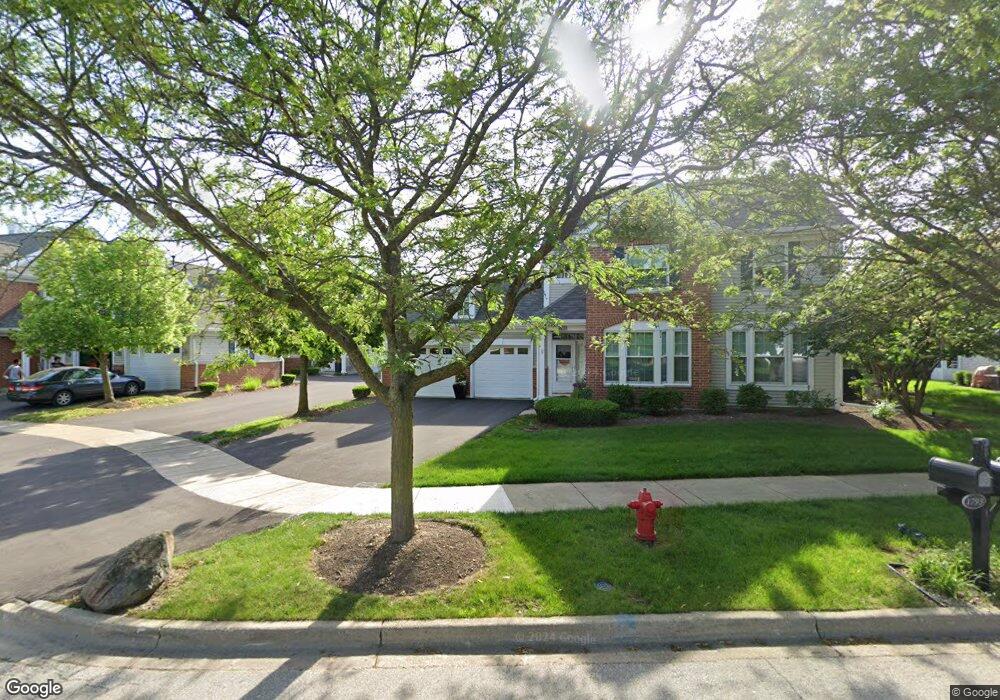
1793 Pontarelli Ct Aurora, IL 60504
Hidden Creek NeighborhoodEstimated Value: $321,000 - $332,122
3
Beds
3
Baths
1,783
Sq Ft
$183/Sq Ft
Est. Value
About This Home
This home is located at 1793 Pontarelli Ct, Aurora, IL 60504 and is currently estimated at $325,531, approximately $182 per square foot. 1793 Pontarelli Ct is a home located in Kendall County with nearby schools including Boulder Hill Elementary School, Thompson Jr. High School, and Oswego High School.
Ownership History
Date
Name
Owned For
Owner Type
Purchase Details
Closed on
Mar 27, 2019
Sold by
Us Bank National Association
Bought by
Plescia Victor and Plescia Bonnie
Current Estimated Value
Home Financials for this Owner
Home Financials are based on the most recent Mortgage that was taken out on this home.
Original Mortgage
$180,667
Outstanding Balance
$159,475
Interest Rate
4.5%
Mortgage Type
FHA
Estimated Equity
$166,056
Purchase Details
Closed on
Jul 7, 2015
Sold by
Bramham Lela
Bought by
U S Bank Trust National Association
Purchase Details
Closed on
Jan 19, 2001
Sold by
Courtyard Villas Llc
Bought by
Bramham Lela
Home Financials for this Owner
Home Financials are based on the most recent Mortgage that was taken out on this home.
Original Mortgage
$153,620
Interest Rate
7.18%
Mortgage Type
FHA
Create a Home Valuation Report for This Property
The Home Valuation Report is an in-depth analysis detailing your home's value as well as a comparison with similar homes in the area
Home Values in the Area
Average Home Value in this Area
Purchase History
| Date | Buyer | Sale Price | Title Company |
|---|---|---|---|
| Plescia Victor | $184,000 | Chicago Title | |
| U S Bank Trust National Association | -- | Premier Title | |
| Bramham Lela | $156,500 | Chicago Title Insurance Co |
Source: Public Records
Mortgage History
| Date | Status | Borrower | Loan Amount |
|---|---|---|---|
| Open | Plescia Victor | $180,667 | |
| Previous Owner | Bramham Lela | $153,620 |
Source: Public Records
Tax History Compared to Growth
Tax History
| Year | Tax Paid | Tax Assessment Tax Assessment Total Assessment is a certain percentage of the fair market value that is determined by local assessors to be the total taxable value of land and additions on the property. | Land | Improvement |
|---|---|---|---|---|
| 2024 | $7,316 | $88,347 | $16,780 | $71,567 |
| 2023 | $6,557 | $76,823 | $14,591 | $62,232 |
| 2022 | $6,557 | $71,132 | $13,510 | $57,622 |
| 2021 | $6,664 | $69,737 | $13,245 | $56,492 |
| 2020 | $6,671 | $69,047 | $13,114 | $55,933 |
| 2019 | $7,329 | $67,683 | $13,114 | $54,569 |
| 2018 | $6,684 | $61,783 | $11,971 | $49,812 |
| 2017 | $6,500 | $56,943 | $11,033 | $45,910 |
| 2016 | $6,256 | $53,975 | $10,458 | $43,517 |
| 2015 | $5,657 | $50,920 | $9,866 | $41,054 |
| 2014 | -- | $48,038 | $9,308 | $38,730 |
| 2013 | -- | $49,524 | $9,596 | $39,928 |
Source: Public Records
Map
Nearby Homes
- 1622 Captiva Dr
- 1038 Emerald Dr
- 1042 Emerald Dr
- 1637 Catalina Ln
- 994 Garnet Ln
- 986 Garnet Ln
- 982 Garnet Ln
- 978 Garnet Ln
- 974 Garnet Ln
- 1739 Baler Ave
- 1745 Baler Ave
- 1764 Stable Ln
- 1776 Stable Ln
- 970 Garnet Ln
- 966 Garnet Ln
- BELLAMY Plan at Marquis Pointe
- HOLCOMBE Plan at Marquis Pointe
- SIENNA Plan at Marquis Pointe
- HENLEY Plan at Marquis Pointe
- 962 Garnet Ln
- 1793 Pontarelli Ct Unit 1793
- 1789 Pontarelli Ct
- 1797 Pontarelli Ct
- 1785 Pontarelli Ct
- 1801 Pontarelli Ct
- 1805 Pontarelli Ct
- 1777 Pontarelli Ct
- 1777 Pontarelli Ct Unit 1755
- 1781 Pontarelli Ct
- 1773 Pontarelli Ct
- 1773 Pontarelli Ct Unit 1773
- 1769 Pontarelli Ct
- 1796 Pontarelli Ct
- 1761 Pontarelli Ct
- 1765 Pontarelli Ct
- 1760 Pontarelli Ct
- 1792 Pontarelli Ct
- 1792 Pontarelli Ct Unit 1792
- 1756 Pontarelli Ct
- 1764 Pontarelli Ct