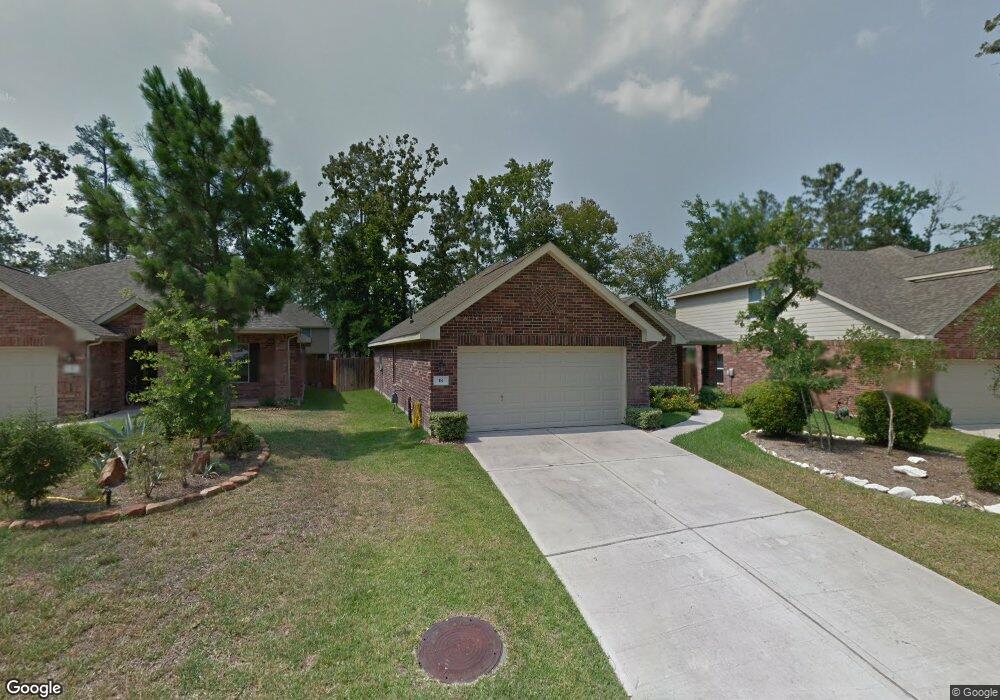
18 Garden Lodge Place Spring, TX 77382
Sterling Ridge NeighborhoodEstimated Value: $290,173 - $361,000
3
Beds
2
Baths
1,518
Sq Ft
$219/Sq Ft
Est. Value
About This Home
This home is located at 18 Garden Lodge Place, Spring, TX 77382 and is currently estimated at $332,793, approximately $219 per square foot. 18 Garden Lodge Place is a home located in Montgomery County with nearby schools including Deretchin Elementary School, McCullough Junior High School, and The Woodlands High School.
Ownership History
Date
Name
Owned For
Owner Type
Purchase Details
Closed on
Jan 24, 2008
Sold by
Cisneros Colleen Perez
Bought by
Alizadeh Jafar and Alizadeh Shirin
Current Estimated Value
Home Financials for this Owner
Home Financials are based on the most recent Mortgage that was taken out on this home.
Original Mortgage
$50,000
Interest Rate
5.82%
Mortgage Type
Purchase Money Mortgage
Purchase Details
Closed on
Sep 13, 2006
Sold by
Lennar Homes Of Texas
Bought by
Cisneros Colleen Perez
Home Financials for this Owner
Home Financials are based on the most recent Mortgage that was taken out on this home.
Original Mortgage
$114,350
Interest Rate
6.64%
Mortgage Type
Purchase Money Mortgage
Purchase Details
Closed on
Dec 14, 2005
Sold by
Woodlands Land Dev Lp
Bought by
Alizadeh Jafar and Alizadeh Shirin
Create a Home Valuation Report for This Property
The Home Valuation Report is an in-depth analysis detailing your home's value as well as a comparison with similar homes in the area
Home Values in the Area
Average Home Value in this Area
Purchase History
| Date | Buyer | Sale Price | Title Company |
|---|---|---|---|
| Alizadeh Jafar | -- | South Land Title Company Of | |
| Cisneros Colleen Perez | -- | North American Title Co | |
| Alizadeh Jafar | -- | -- |
Source: Public Records
Mortgage History
| Date | Status | Borrower | Loan Amount |
|---|---|---|---|
| Closed | Alizadeh Jafar | $50,000 | |
| Previous Owner | Cisneros Colleen Perez | $114,350 |
Source: Public Records
Tax History Compared to Growth
Tax History
| Year | Tax Paid | Tax Assessment Tax Assessment Total Assessment is a certain percentage of the fair market value that is determined by local assessors to be the total taxable value of land and additions on the property. | Land | Improvement |
|---|---|---|---|---|
| 2025 | $5,955 | $331,957 | $50,000 | $281,957 |
| 2024 | $5,488 | $323,921 | $50,000 | $273,921 |
| 2023 | $5,488 | $304,360 | $50,000 | $254,360 |
| 2022 | $5,958 | $294,820 | $50,000 | $244,820 |
| 2021 | $4,391 | $201,250 | $35,650 | $165,600 |
| 2020 | $4,794 | $210,450 | $35,650 | $174,800 |
| 2019 | $4,957 | $210,540 | $35,650 | $174,890 |
| 2018 | $4,762 | $202,280 | $35,650 | $166,630 |
| 2017 | $4,821 | $202,280 | $35,650 | $166,630 |
| 2016 | $4,821 | $202,280 | $35,650 | $166,630 |
| 2015 | $4,436 | $212,080 | $35,650 | $176,430 |
| 2014 | $4,436 | $183,510 | $35,650 | $147,860 |
Source: Public Records
Map
Nearby Homes
- 35 N Star Ridge Cir
- 158 S Star Ridge Cir
- 146 S Star Ridge Cir
- 163 N Hawkhurst Cir
- 166 Hawkhurst Cir
- 2 Craven Park Ct
- 10 Barker Ridge Ct
- 30 Black Swan Ct
- 51 N Scribewood Cir
- 115 Black Swan Place
- 119 Benedict Canyon Loop
- 166 Black Swan Place
- 30 N Scribewood Cir
- 78 S Bardsbrook Cir
- 31 N Spinning Wheel Cir
- 34 Gilmore Grove Place
- 22 Bryce Branch Cir
- 207 N Vershire Cir
- 14 Trailing Lantana Place
- 14 Cordella Place
- 14 Garden Lodge Place
- 10 Garden Lodge Place
- 26 Garden Lodge Place
- 31 N Star Ridge Cir
- 27 N Star Ridge Cir
- 23 N Star Ridge Cir
- 6 Garden Lodge Place
- 30 Garden Lodge Place
- 39 N Star Ridge Cir
- 15 Garden Lodge Place
- 19 Garden Lodge Place
- 47 N Star Ridge Cir
- 7 Garden Lodge Place
- 31 Garden Lodge Place
- 11 N Star Ridge Cir
- 55 N Star Ridge Cir
- 23 Garden Lodge Place
- 27 Garden Lodge Place
- 67 N Star Ridge Cir
- 7 N Star Ridge Cir