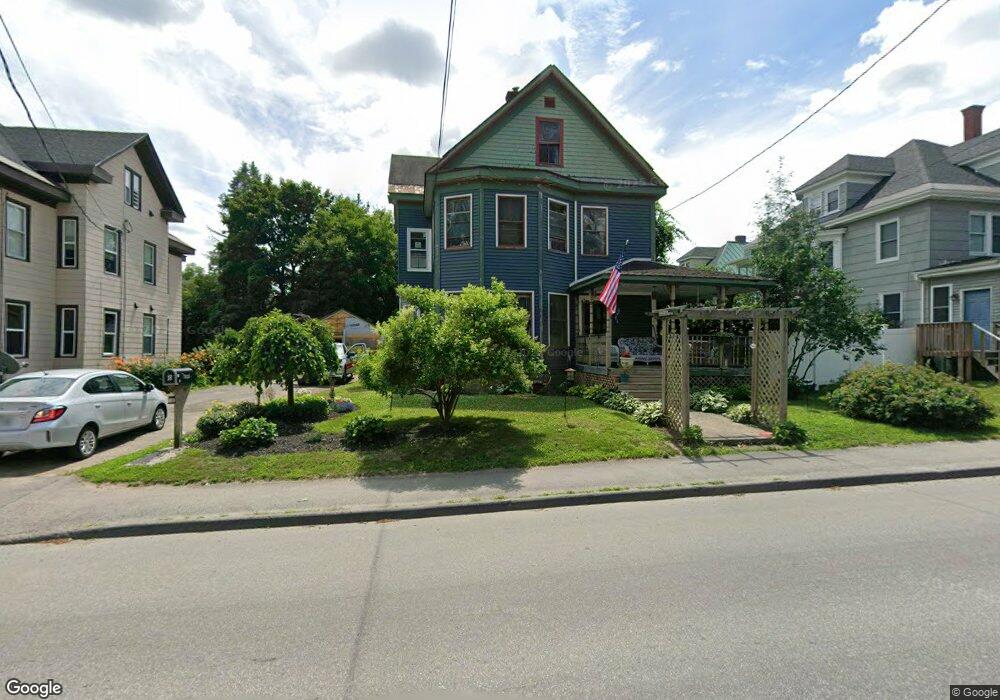
18 Gilman St Waterville, ME 04901
Estimated Value: $265,000 - $365,000
6
Beds
3
Baths
3,085
Sq Ft
$101/Sq Ft
Est. Value
About This Home
This home is located at 18 Gilman St, Waterville, ME 04901 and is currently estimated at $310,745, approximately $100 per square foot. 18 Gilman St is a home located in Kennebec County with nearby schools including George J. Mitchell School, Albert S. Hall School, and Waterville Junior High School.
Ownership History
Date
Name
Owned For
Owner Type
Purchase Details
Closed on
Jul 14, 2021
Sold by
Waterville Town Of
Bought by
Carver Lenwood N and Carver Sheila G
Current Estimated Value
Purchase Details
Closed on
Oct 30, 2019
Sold by
Warren Eva and Warren Jerry
Bought by
Deas David C and Deas Jeanine R
Purchase Details
Closed on
Feb 21, 2014
Sold by
Department Of Housing & Urban Dev
Bought by
Carver Lenwood N and Carver Sheila G
Purchase Details
Closed on
Oct 15, 2013
Sold by
Trayer Todd and Wells Fargo Bank Na
Bought by
Department Of Housing & Urban Dev
Purchase Details
Closed on
Apr 1, 2013
Sold by
Waterville Town Of
Bought by
Trayer Elisa and Trayer Todd
Purchase Details
Closed on
May 20, 2005
Sold by
Maheu Mark A
Bought by
Trayer Elisa J and Trayer Todd A
Home Financials for this Owner
Home Financials are based on the most recent Mortgage that was taken out on this home.
Original Mortgage
$154,400
Interest Rate
5.95%
Mortgage Type
Purchase Money Mortgage
Create a Home Valuation Report for This Property
The Home Valuation Report is an in-depth analysis detailing your home's value as well as a comparison with similar homes in the area
Home Values in the Area
Average Home Value in this Area
Purchase History
| Date | Buyer | Sale Price | Title Company |
|---|---|---|---|
| Carver Lenwood N | -- | None Available | |
| Carver Lenwood N | -- | None Available | |
| Carver Lenwood N | -- | None Available | |
| Deas David C | -- | -- | |
| Deas David C | -- | -- | |
| Deas David C | -- | -- | |
| Carver Lenwood N | -- | -- | |
| Carver Lenwood N | -- | -- | |
| Department Of Housing & Urban Dev | -- | -- | |
| Department Of Housing & Urban Dev | -- | -- | |
| Trayer Elisa | -- | -- | |
| Trayer Elisa | -- | -- | |
| Trayer Elisa | -- | -- | |
| Trayer Elisa J | -- | -- | |
| Trayer Elisa J | -- | -- | |
| Trayer Elisa J | -- | -- |
Source: Public Records
Mortgage History
| Date | Status | Borrower | Loan Amount |
|---|---|---|---|
| Previous Owner | Trayer Elisa J | $154,400 |
Source: Public Records
Tax History Compared to Growth
Tax History
| Year | Tax Paid | Tax Assessment Tax Assessment Total Assessment is a certain percentage of the fair market value that is determined by local assessors to be the total taxable value of land and additions on the property. | Land | Improvement |
|---|---|---|---|---|
| 2025 | $3,842 | $226,000 | $26,400 | $199,600 |
| 2024 | $3,622 | $181,100 | $20,300 | $160,800 |
| 2023 | $3,604 | $181,100 | $20,300 | $160,800 |
| 2022 | $3,702 | $143,200 | $15,300 | $127,900 |
| 2021 | $3,991 | $156,500 | $15,300 | $141,200 |
| 2020 | $4,031 | $156,500 | $15,300 | $141,200 |
| 2019 | $4,031 | $156,500 | $15,300 | $141,200 |
| 2018 | $3,955 | $156,500 | $15,300 | $141,200 |
| 2017 | $3,651 | $156,500 | $15,300 | $141,200 |
| 2016 | $3,568 | $156,500 | $15,300 | $141,200 |
| 2015 | $3,150 | $113,300 | $17,500 | $95,800 |
| 2014 | $3,104 | $113,300 | $17,500 | $95,800 |
| 2013 | $3,104 | $113,300 | $17,500 | $95,800 |
Source: Public Records
Map
Nearby Homes