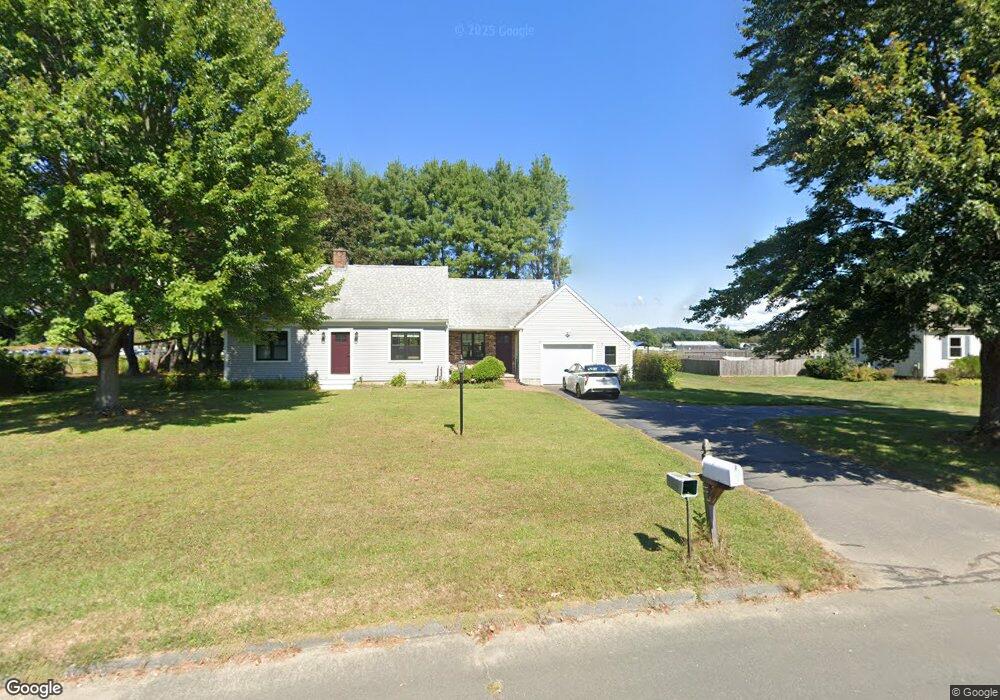
18 Hadley Place Hadley, MA 01035
Estimated Value: $485,000 - $538,000
2
Beds
3
Baths
1,649
Sq Ft
$308/Sq Ft
Est. Value
About This Home
This home is located at 18 Hadley Place, Hadley, MA 01035 and is currently estimated at $508,136, approximately $308 per square foot. 18 Hadley Place is a home located in Hampshire County with nearby schools including Hadley Elementary School, Pioneer Valley Chinese Immersion Charter School, and The Hartsbrook School.
Ownership History
Date
Name
Owned For
Owner Type
Purchase Details
Closed on
May 13, 2011
Sold by
Dubiel Patricia
Bought by
Mackenzie Jeffrey M and Mackenzie Jo Ellen
Current Estimated Value
Purchase Details
Closed on
Jul 14, 2006
Sold by
Canedy Jean H
Bought by
Dubiel Patricia
Purchase Details
Closed on
Jun 21, 1999
Sold by
Orson Lorraine D and Orson Theodore S
Bought by
Canedy Jean H and Canedy Lewis H
Create a Home Valuation Report for This Property
The Home Valuation Report is an in-depth analysis detailing your home's value as well as a comparison with similar homes in the area
Home Values in the Area
Average Home Value in this Area
Purchase History
| Date | Buyer | Sale Price | Title Company |
|---|---|---|---|
| Mackenzie Jeffrey M | -- | -- | |
| Dubiel Patricia | $309,900 | -- | |
| Canedy Jean H | $173,000 | -- | |
| Mackenzie Jeffrey M | -- | -- | |
| Dubiel Patricia | $309,900 | -- | |
| Canedy Jean H | $173,000 | -- |
Source: Public Records
Mortgage History
| Date | Status | Borrower | Loan Amount |
|---|---|---|---|
| Previous Owner | Canedy Jean H | $119,600 | |
| Previous Owner | Canedy Jean H | $113,600 |
Source: Public Records
Tax History Compared to Growth
Tax History
| Year | Tax Paid | Tax Assessment Tax Assessment Total Assessment is a certain percentage of the fair market value that is determined by local assessors to be the total taxable value of land and additions on the property. | Land | Improvement |
|---|---|---|---|---|
| 2025 | $4,291 | $369,000 | $119,400 | $249,600 |
| 2024 | $3,989 | $350,200 | $119,400 | $230,800 |
| 2023 | $4,041 | $350,200 | $119,400 | $230,800 |
| 2022 | $3,776 | $310,000 | $119,400 | $190,600 |
| 2021 | $3,576 | $298,000 | $119,400 | $178,600 |
| 2020 | $3,526 | $275,900 | $119,400 | $156,500 |
| 2019 | $3,273 | $264,800 | $119,400 | $145,400 |
| 2018 | $3,201 | $264,800 | $119,400 | $145,400 |
| 2017 | $3,089 | $267,000 | $119,400 | $147,600 |
| 2016 | $2,977 | $267,000 | $119,400 | $147,600 |
| 2015 | $2,900 | $267,000 | $119,400 | $147,600 |
| 2014 | $2,841 | $267,000 | $119,400 | $147,600 |
Source: Public Records
Map
Nearby Homes