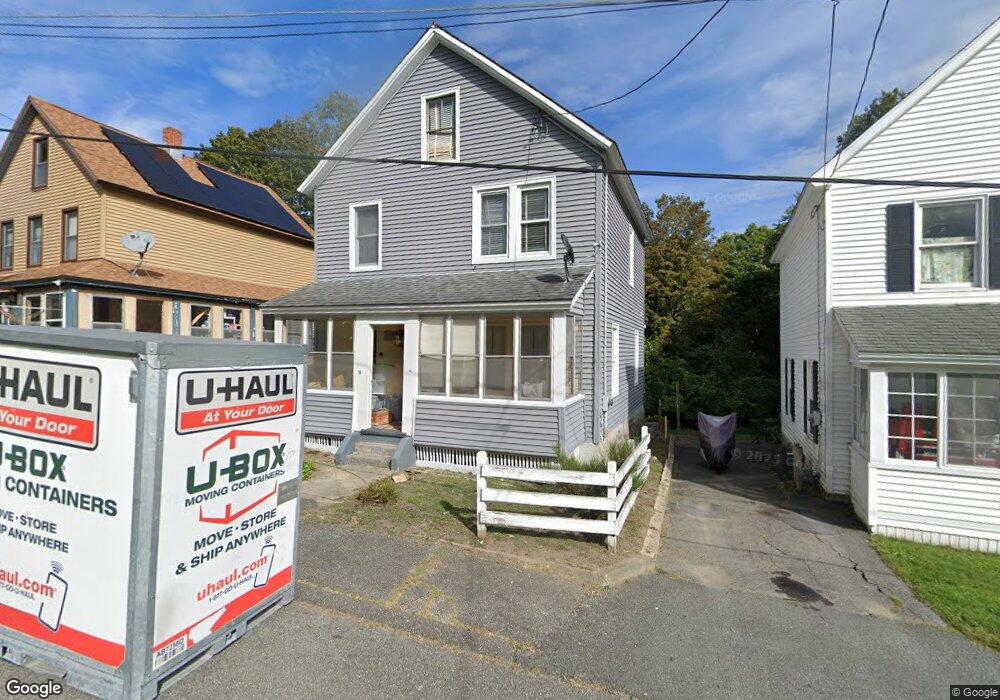
18 Nelson St North Adams, MA 01247
Estimated Value: $177,000 - $194,000
3
Beds
1
Bath
1,144
Sq Ft
$165/Sq Ft
Est. Value
About This Home
This home is located at 18 Nelson St, North Adams, MA 01247 and is currently estimated at $188,662, approximately $164 per square foot. 18 Nelson St is a home located in Berkshire County with nearby schools including Greylock Elementary School and Drury High School.
Ownership History
Date
Name
Owned For
Owner Type
Purchase Details
Closed on
Sep 19, 2025
Sold by
Forth Joyce C
Bought by
Tondreau Erik and Tondreau Erica
Current Estimated Value
Purchase Details
Closed on
Oct 11, 1994
Sold by
Morse Geraldine R
Bought by
Forth Joyce C
Home Financials for this Owner
Home Financials are based on the most recent Mortgage that was taken out on this home.
Original Mortgage
$22,000
Interest Rate
8.55%
Mortgage Type
Purchase Money Mortgage
Create a Home Valuation Report for This Property
The Home Valuation Report is an in-depth analysis detailing your home's value as well as a comparison with similar homes in the area
Home Values in the Area
Average Home Value in this Area
Purchase History
| Date | Buyer | Sale Price | Title Company |
|---|---|---|---|
| Tondreau Erik | $112,000 | -- | |
| Forth Joyce C | $22,000 | -- | |
| Forth Joyce C | $22,000 | -- |
Source: Public Records
Mortgage History
| Date | Status | Borrower | Loan Amount |
|---|---|---|---|
| Previous Owner | Forth Joyce C | $22,000 |
Source: Public Records
Tax History Compared to Growth
Tax History
| Year | Tax Paid | Tax Assessment Tax Assessment Total Assessment is a certain percentage of the fair market value that is determined by local assessors to be the total taxable value of land and additions on the property. | Land | Improvement |
|---|---|---|---|---|
| 2025 | $2,659 | $159,100 | $27,000 | $132,100 |
| 2024 | $2,496 | $145,600 | $24,700 | $120,900 |
| 2023 | $2,382 | $134,800 | $24,700 | $110,100 |
| 2022 | $2,157 | $116,400 | $24,700 | $91,700 |
| 2021 | $2,004 | $107,700 | $22,800 | $84,900 |
| 2020 | $1,925 | $103,400 | $22,700 | $80,700 |
| 2019 | $1,842 | $96,400 | $22,700 | $73,700 |
| 2018 | $1,768 | $96,200 | $23,900 | $72,300 |
| 2017 | $1,684 | $95,300 | $23,700 | $71,600 |
| 2016 | $1,633 | $93,900 | $23,700 | $70,200 |
| 2015 | $1,581 | $94,700 | $24,500 | $70,200 |
Source: Public Records
Map
Nearby Homes