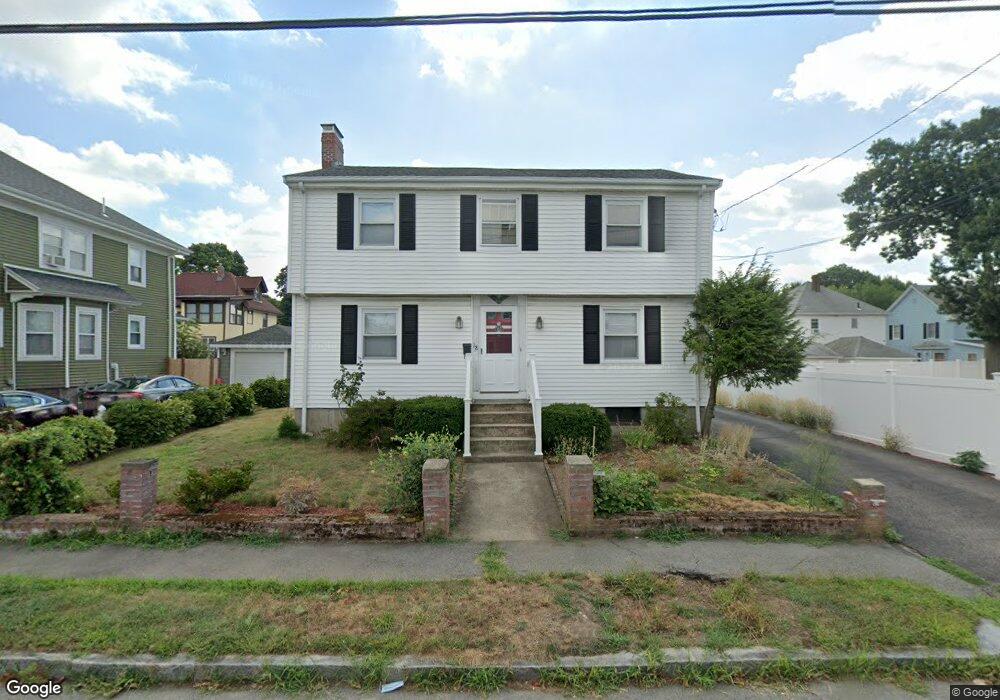
18 Shirley St Quincy, MA 02169
West Quincy NeighborhoodEstimated Value: $707,560 - $823,000
3
Beds
2
Baths
1,568
Sq Ft
$489/Sq Ft
Est. Value
About This Home
This home is located at 18 Shirley St, Quincy, MA 02169 and is currently estimated at $766,390, approximately $488 per square foot. 18 Shirley St is a home located in Norfolk County with nearby schools including Charles A. Bernazzani Elementary School, Central Middle School, and North Quincy High School.
Ownership History
Date
Name
Owned For
Owner Type
Purchase Details
Closed on
Feb 9, 1987
Sold by
Tat Ha
Bought by
Truong Dieu
Current Estimated Value
Home Financials for this Owner
Home Financials are based on the most recent Mortgage that was taken out on this home.
Original Mortgage
$70,000
Interest Rate
9.23%
Mortgage Type
Purchase Money Mortgage
Create a Home Valuation Report for This Property
The Home Valuation Report is an in-depth analysis detailing your home's value as well as a comparison with similar homes in the area
Home Values in the Area
Average Home Value in this Area
Purchase History
| Date | Buyer | Sale Price | Title Company |
|---|---|---|---|
| Truong Dieu | $172,000 | -- |
Source: Public Records
Mortgage History
| Date | Status | Borrower | Loan Amount |
|---|---|---|---|
| Open | Truong Dieu | $255,000 | |
| Closed | Truong Dieu | $70,000 |
Source: Public Records
Tax History Compared to Growth
Tax History
| Year | Tax Paid | Tax Assessment Tax Assessment Total Assessment is a certain percentage of the fair market value that is determined by local assessors to be the total taxable value of land and additions on the property. | Land | Improvement |
|---|---|---|---|---|
| 2025 | $6,834 | $592,700 | $268,800 | $323,900 |
| 2024 | $6,462 | $573,400 | $256,000 | $317,400 |
| 2023 | $6,000 | $539,100 | $243,800 | $295,300 |
| 2022 | $5,626 | $469,600 | $195,100 | $274,500 |
| 2021 | $5,553 | $457,400 | $195,100 | $262,300 |
| 2020 | $5,369 | $431,900 | $195,100 | $236,800 |
| 2019 | $5,368 | $427,700 | $189,400 | $238,300 |
| 2018 | $5,277 | $395,600 | $175,300 | $220,300 |
| 2017 | $5,198 | $366,800 | $167,000 | $199,800 |
| 2016 | $4,865 | $338,800 | $151,800 | $187,000 |
| 2015 | $4,596 | $314,800 | $143,200 | $171,600 |
| 2014 | $4,464 | $300,400 | $143,200 | $157,200 |
Source: Public Records
Map
Nearby Homes
- 10 White St
- 73 Connell St
- 41 Wallace Rd
- 11 Rockwell Ave
- 60 Pond St
- 121 Hillside Ave
- 171 Milton St
- 66 Unity St
- 169 Pine St
- 129-131 Pine St
- 89 Puritan Dr
- 64 Shawmut St
- 29 Oconnell Ave
- 111 Shawmut St
- 25 Carrolls Ln
- 45 Marion St
- 1 Cityview Ln Unit 506
- 1 Cityview Ln Unit 210
- 1 Cityview Ln Unit 709
- 323 Farrington St
- 10 Shirley St
- 19 Campbell St
- 22 Shirley St
- 26 Shirley St
- 23 Campbell St
- 11 Campbell St
- 27 Campbell St
- 28 Shirley St
- 23 Shirley St
- 31 Campbell St
- 32 Shirley St
- 646 Adams St
- 22 Campbell St
- 0 Confedential Treet Unit 70582095
- 35 Campbell St
- 16 Campbell St
- 29 Shirley St
- 14 Campbell St
- 18 Robertson St
- 20 Robertson St