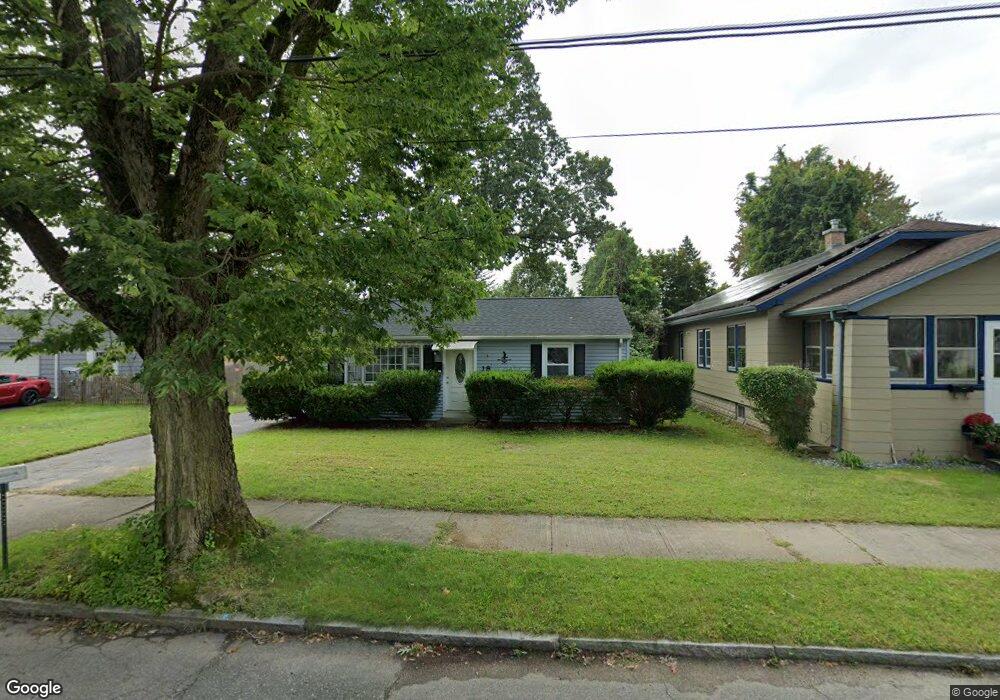
18 Superior Ave Indian Orchard, MA 01151
Indian Orchard NeighborhoodEstimated Value: $202,000 - $227,000
2
Beds
1
Bath
714
Sq Ft
$307/Sq Ft
Est. Value
About This Home
This home is located at 18 Superior Ave, Indian Orchard, MA 01151 and is currently estimated at $218,885, approximately $306 per square foot. 18 Superior Ave is a home located in Hampden County with nearby schools including Hiram L. Dorman Elementary, John F. Kennedy Academy, and Springfield Central High School.
Ownership History
Date
Name
Owned For
Owner Type
Purchase Details
Closed on
Mar 14, 2024
Sold by
Randall James
Bought by
Crespo Antonio and Crespo Amanda
Current Estimated Value
Purchase Details
Closed on
Jun 30, 2022
Sold by
Elander Mary D
Bought by
Randall James
Purchase Details
Closed on
Jan 27, 1986
Bought by
Elander Mary Diane
Create a Home Valuation Report for This Property
The Home Valuation Report is an in-depth analysis detailing your home's value as well as a comparison with similar homes in the area
Home Values in the Area
Average Home Value in this Area
Purchase History
| Date | Buyer | Sale Price | Title Company |
|---|---|---|---|
| Crespo Antonio | $160,000 | None Available | |
| Randall James | $55,000 | None Available | |
| Elander Mary Diane | $35,000 | -- |
Source: Public Records
Mortgage History
| Date | Status | Borrower | Loan Amount |
|---|---|---|---|
| Previous Owner | Elander Mary Diane | $16,900 | |
| Previous Owner | Elander Mary Diane | $13,200 |
Source: Public Records
Tax History Compared to Growth
Tax History
| Year | Tax Paid | Tax Assessment Tax Assessment Total Assessment is a certain percentage of the fair market value that is determined by local assessors to be the total taxable value of land and additions on the property. | Land | Improvement |
|---|---|---|---|---|
| 2025 | $2,891 | $184,400 | $43,000 | $141,400 |
| 2024 | $2,714 | $169,000 | $40,200 | $128,800 |
| 2023 | $2,194 | $128,700 | $32,900 | $95,800 |
| 2022 | $2,010 | $106,800 | $30,800 | $76,000 |
| 2021 | $2,085 | $110,300 | $28,000 | $82,300 |
| 2020 | $2,183 | $111,800 | $28,000 | $83,800 |
| 2019 | $1,822 | $92,600 | $29,000 | $63,600 |
| 2018 | $1,755 | $95,200 | $29,000 | $66,200 |
| 2017 | $1,649 | $83,900 | $24,700 | $59,200 |
| 2016 | $1,490 | $75,800 | $24,700 | $51,100 |
| 2015 | $1,406 | $71,500 | $24,700 | $46,800 |
Source: Public Records
Map
Nearby Homes
- 37 Champlain Ave
- 42 Geneva St
- 49 Mohegan Ave
- 108 Barre St
- 140 Cardinal St
- 98 Pine Grove St
- 97-99 Pine Grove St
- 0 Michon St
- 89 Pine Grove St
- 34 Wallace St
- 39 Wallace St
- 34 Temby St
- 320 Tremont St
- 70 Shumway St Unit 29
- 70 Shumway St Unit A1
- 19 Emily St
- 31 Wing St
- 543 Boston Rd
- 32 Better Way
- 25 Pioneer Way
- 14 Superior Ave
- 28 Superior Ave
- 17 Michigan St
- 21 Michigan St
- 6 Superior Ave
- 1013 Berkshire Ave
- 23 Superior Ave
- 34 Superior Ave
- 1009 Berkshire Ave
- 1035 Berkshire Ave
- 1007 Berkshire Ave
- 11 Superior Ave
- 33 Michigan St
- 38 Superior Ave
- 33 Superior Ave
- 1039 Berkshire Ave
- 1039 Berkshire Ave Unit 1
- 44 Superior Ave
- 20 Lorimer St
- 14 Lorimer St