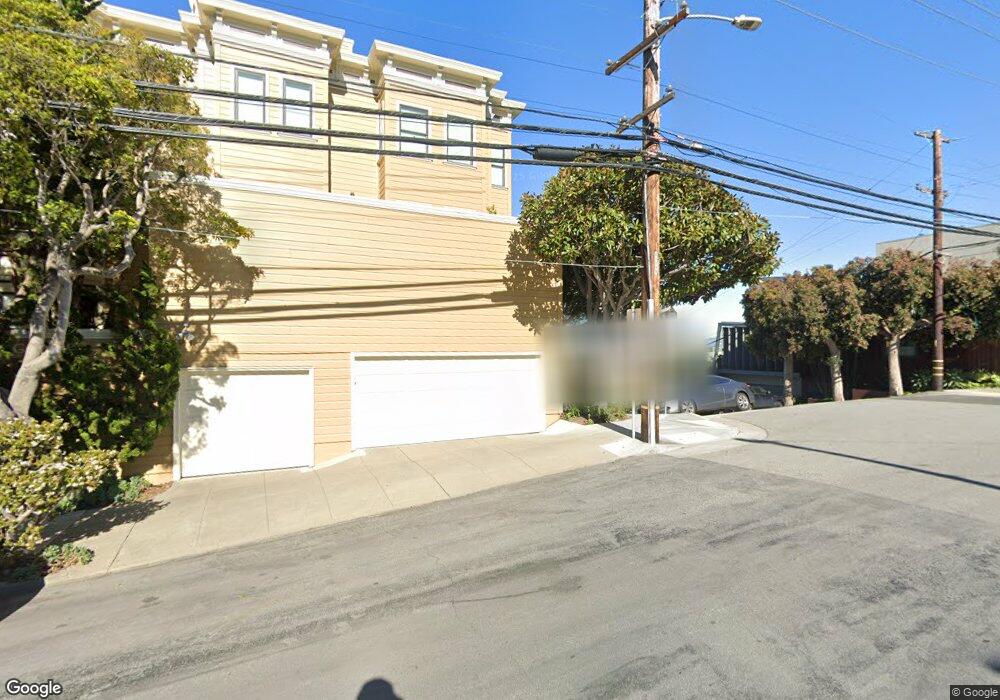
1800 20th St San Francisco, CA 94107
Potrero NeighborhoodEstimated Value: $1,829,000
--
Bed
--
Bath
11,834
Sq Ft
$155/Sq Ft
Est. Value
About This Home
This home is located at 1800 20th St, San Francisco, CA 94107 and is currently priced at $1,829,000, approximately $154 per square foot. 1800 20th St is a home located in San Francisco County with nearby schools including Daniel Webster Elementary School, James Lick Middle School, and The New School of San Francisco.
Ownership History
Date
Name
Owned For
Owner Type
Purchase Details
Closed on
Jan 26, 2018
Sold by
Ceibo Investments Fund 6 Llc
Bought by
Ceibo Investments Fund 6 Llc
Current Estimated Value
Home Financials for this Owner
Home Financials are based on the most recent Mortgage that was taken out on this home.
Original Mortgage
$2,500,000
Outstanding Balance
$2,117,274
Interest Rate
3.99%
Mortgage Type
Commercial
Purchase Details
Closed on
Oct 25, 2013
Sold by
Bright Michael and Bright George
Bought by
Ceibo Investments Fund 6 Llc
Home Financials for this Owner
Home Financials are based on the most recent Mortgage that was taken out on this home.
Original Mortgage
$1,170,000
Interest Rate
4.17%
Mortgage Type
Stand Alone Second
Purchase Details
Closed on
Oct 7, 2010
Sold by
Bright Michael
Bought by
Bright Michael and Bright George
Purchase Details
Closed on
Jan 11, 2002
Sold by
Bright Raymond E and Bright Marcelle J
Bought by
Bright Raymond E and Bright Marcelle J
Create a Home Valuation Report for This Property
The Home Valuation Report is an in-depth analysis detailing your home's value as well as a comparison with similar homes in the area
Home Values in the Area
Average Home Value in this Area
Purchase History
| Date | Buyer | Sale Price | Title Company |
|---|---|---|---|
| Ceibo Investments Fund 6 Llc | -- | Old Republic Title Co | |
| Ceibo Investments Fund 6 Llc | $1,680,000 | Old Republic Title Company | |
| Bright Michael | -- | None Available | |
| Bright Raymond E | -- | -- | |
| Bright Raymond E | -- | -- |
Source: Public Records
Mortgage History
| Date | Status | Borrower | Loan Amount |
|---|---|---|---|
| Open | Ceibo Investments Fund 6 Llc | $2,500,000 | |
| Closed | Ceibo Investments Fund 6 Llc | $1,170,000 |
Source: Public Records
Tax History Compared to Growth
Tax History
| Year | Tax Paid | Tax Assessment Tax Assessment Total Assessment is a certain percentage of the fair market value that is determined by local assessors to be the total taxable value of land and additions on the property. | Land | Improvement |
|---|---|---|---|---|
| 2025 | $24,484 | $2,062,661 | $1,029,718 | $1,029,718 |
| 2024 | $24,484 | $2,022,731 | $1,009,528 | $1,009,528 |
| 2023 | $24,127 | $1,983,593 | $989,734 | $989,734 |
| 2022 | $23,677 | $1,944,856 | $970,328 | $970,328 |
| 2021 | $23,266 | $1,907,179 | $951,302 | $955,877 |
| 2020 | $24,508 | $1,883,096 | $941,548 | $941,548 |
| 2019 | $22,507 | $1,846,174 | $923,087 | $923,087 |
| 2018 | $21,749 | $1,809,976 | $904,988 | $904,988 |
| 2017 | $21,194 | $1,774,488 | $887,244 | $887,244 |
| 2016 | $20,867 | $1,739,696 | $869,848 | $869,848 |
| 2015 | $20,610 | $1,713,566 | $856,783 | $856,783 |
| 2014 | $20,066 | $3,560,591 | $2,136,355 | $1,424,236 |
Source: Public Records
Map
Nearby Homes
- 631 Carolina St
- 1812 20th St
- 666 Carolina St Unit 666
- 700 De Haro St
- 352 Arkansas St
- 561 Connecticut St
- 573 Connecticut St
- 264 Missouri St
- 2023 22nd St
- 1002 Rhode Island St Unit 1
- 2119 22nd St
- 451 Kansas St Unit 410
- 448 Pennsylvania Ave
- 2225 Mariposa St
- 601 Pennsylvania Ave
- 699 Pennsylvania Ave Unit 2
- 2325 Mariposa St
- 507 Potrero Ave
- 999 16th St Unit 11
- 701 Pennsylvania Ave Unit 109
- 649 Wisconsin St
- 568 Wisconsin St
- 556 Wisconsin St
- 566 Wisconsin St
- 560 Wisconsin St
- 554 Wisconsin St
- 562 Wisconsin St
- 578 Wisconsin St
- 582 Wisconsin St Unit 33
- 574 Wisconsin St
- 592 Wisconsin St
- 500 Wisconsin St
- 580 Wisconsin St
- 584 Wisconsin St
- 576 Wisconsin St
- 655 Carolina St
- 649 Carolina St
- 665 Carolina St
- 661 Carolina St
- 645 Carolina St