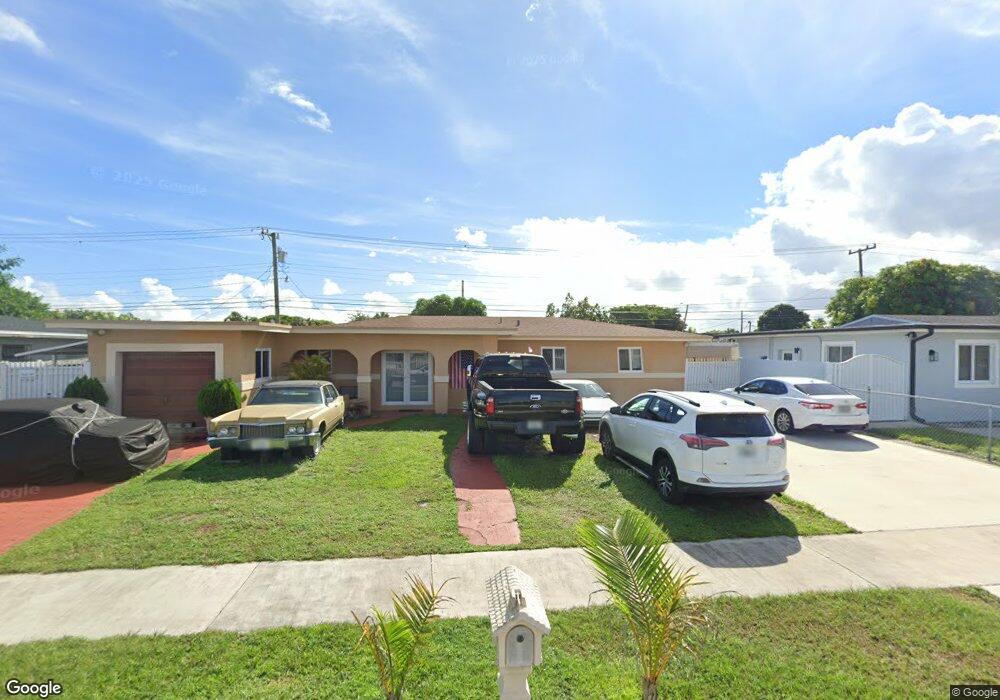
18015 NW 42nd Ct Unit B Miami Gardens, FL 33055
Carol City NeighborhoodEstimated Value: $502,667 - $615,000
1
Bed
1
Bath
1,274
Sq Ft
$421/Sq Ft
Est. Value
About This Home
This home is located at 18015 NW 42nd Ct Unit B, Miami Gardens, FL 33055 and is currently estimated at $536,167, approximately $420 per square foot. 18015 NW 42nd Ct Unit B is a home located in Miami-Dade County with nearby schools including Carol City Elementary School, Carol City Middle School, and Miami Carol City Senior High School.
Ownership History
Date
Name
Owned For
Owner Type
Purchase Details
Closed on
Sep 28, 2024
Sold by
Diaz Ifrain
Bought by
Diaz Yanilis
Current Estimated Value
Purchase Details
Closed on
Sep 19, 2014
Sold by
5435 Llc
Bought by
Diaz Yanilis and Rodriguez Maria A
Home Financials for this Owner
Home Financials are based on the most recent Mortgage that was taken out on this home.
Original Mortgage
$178,703
Interest Rate
4.37%
Mortgage Type
FHA
Purchase Details
Closed on
May 14, 2014
Sold by
Rolle Barbara
Bought by
5435 Llc
Purchase Details
Closed on
Aug 24, 2006
Sold by
Rolle Leroy A
Bought by
Rolle Barbara A
Purchase Details
Closed on
Jul 3, 1995
Sold by
Leveque Nesly and Leveque Ulna
Bought by
Rolle Leroy A and Rolle Barbara A
Home Financials for this Owner
Home Financials are based on the most recent Mortgage that was taken out on this home.
Original Mortgage
$58,400
Interest Rate
7.79%
Create a Home Valuation Report for This Property
The Home Valuation Report is an in-depth analysis detailing your home's value as well as a comparison with similar homes in the area
Home Values in the Area
Average Home Value in this Area
Purchase History
| Date | Buyer | Sale Price | Title Company |
|---|---|---|---|
| Diaz Yanilis | -- | None Listed On Document | |
| Diaz Yanilis | $186,000 | Excellence Title Agency Inc | |
| 5435 Llc | $117,254 | None Available | |
| Rolle Barbara A | -- | Attorney | |
| Rolle Leroy A | $73,000 | -- |
Source: Public Records
Mortgage History
| Date | Status | Borrower | Loan Amount |
|---|---|---|---|
| Previous Owner | Diaz Yanilis | $178,703 | |
| Previous Owner | Rolle Leroy A | $58,400 |
Source: Public Records
Tax History Compared to Growth
Tax History
| Year | Tax Paid | Tax Assessment Tax Assessment Total Assessment is a certain percentage of the fair market value that is determined by local assessors to be the total taxable value of land and additions on the property. | Land | Improvement |
|---|---|---|---|---|
| 2025 | $3,843 | $183,455 | -- | -- |
| 2024 | $3,617 | $178,285 | -- | -- |
| 2023 | $3,617 | $173,093 | $0 | $0 |
| 2022 | $3,470 | $168,052 | $0 | $0 |
| 2021 | $3,404 | $163,158 | $0 | $0 |
| 2020 | $3,366 | $160,906 | $0 | $0 |
| 2019 | $3,299 | $157,289 | $0 | $0 |
| 2018 | $3,162 | $154,357 | $0 | $0 |
| 2017 | $3,035 | $147,424 | $0 | $0 |
| 2016 | $2,971 | $144,392 | $0 | $0 |
| 2015 | $3,669 | $128,879 | $0 | $0 |
| 2014 | $1,337 | $74,401 | $0 | $0 |
Source: Public Records
Map
Nearby Homes
- 18001 NW 42nd Place
- 18046 NW 41st Place
- 17911 NW 42nd Place
- 17930 NW 42nd Place
- 18410 NW 42nd Ave
- 17935 NW 44th Ct
- 3956 NW 182nd Ln
- 3954 NW 182nd Ln
- 3952 NW 182nd Ln
- 3880 NW 179th St
- 18520 NW 42nd Place
- 18423 NW 44th Place
- 18600 NW 42nd Place
- 4331 NW 185th St
- 3861 NW 177th St
- 4030 NW 187th St
- 4457 NW 185th St
- 18535 NW 39th Ct
- 4410 NW 174th Dr
- 3930 NW 187th St
- 18015 NW 42nd Ct
- 18001 NW 42nd Ct
- 18025 NW 42nd Ct
- 18010 NW 42nd Ave
- 18000 NW 42nd Ave
- 18020 NW 42nd Ave
- 18020 NW 42nd Ct
- 18101 NW 42nd Ct
- 18000 NW 42nd Ct
- 18100 NW 42nd Ave
- 17940 NW 42nd Ct
- 17935 NW 42nd Ct
- 18115 NW 42nd Ct
- 18100 NW 42nd Ct
- 17930 NW 42nd Ave
- 18025 NW 42nd Place
- 18110 NW 42nd Ave
- 17930 NW 42nd Ct